One Choice® Target Date Portfolios
An Intentionally Moderate Approach
Target-date portfolios were never meant to be a high-stakes gamble for investors.
The original intent of target-date portfolios was to offer retirement savers an investment option that focused on growing wealth over time while becoming more conservative as retirement neared. But, over the most recent decade, an increasing number of target-date providers have moved to a more aggressive equity positioning, justified by trends extrapolated from an unprecedented bull market.1
We believe this doubling down on growth in the primary retirement solution for most defined contribution plans disregards the inherent risk that market conditions will, can and do turn negative—which may result in losses for participants that they may have a hard time recovering from.
We have stayed true to target date's original purpose with our design—an intentionally moderate approach.
Why? It's math. When you aim for the highest growth, you also introduce a higher risk of loss. The more a portfolio loses, the more it must gain to get back to even.
The target date in a fund’s name is the approximate year when investors plan to retire or start withdrawing their money. The principal value of the investment is not guaranteed at any time, including at the target date. Each target-date fund seeks the highest total return consistent with its proprietary asset mix. Over time, the asset mix and weightings are adjusted to be more conservative. In general, as the target year approaches, the portfolio's allocation becomes more conservative by decreasing the allocation to stocks and increasing the allocation to bonds.
¹ Source: S&P Dow Jones Indices LLC, Morningstar. Data as of May 31, 2015 and as of Dec. 29, 2023.
Our more moderate, risk-balanced approach may generate a smoother path of investment returns which we expect could lead to better outcomes over time for investors.
Pursues a smoother investor journey through a flatter glide path.
Focuses on providing better outcomes for tomorrow by managing across the entire market cycle.
Aligns with a more risk-balanced approach.
Pursues a Smoother Path of Performance
Our Balance of Risks Framework
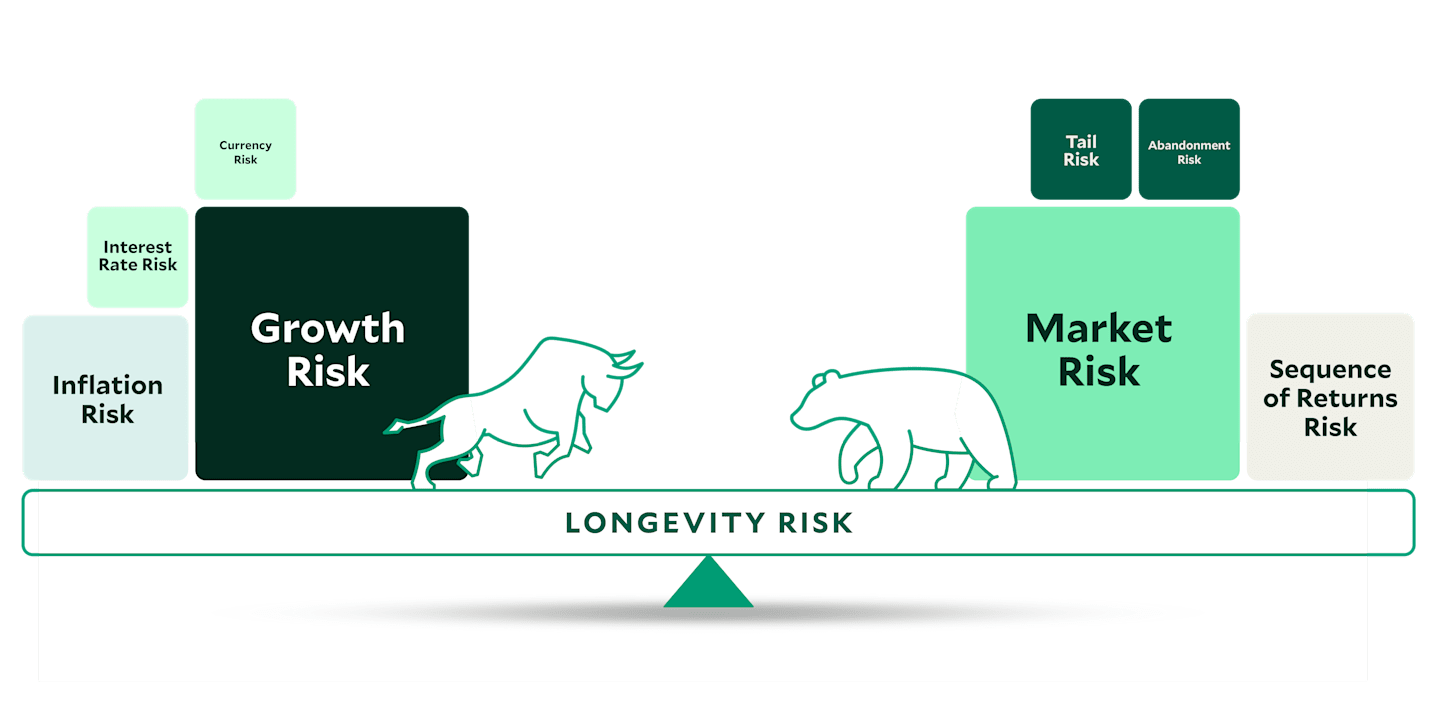
Tail risk is the risk of a tail event. Please see our glossary for definitions of tail event, sequence-of-returns risk, and longevity risk. For more information on longevity risk, view our article.
Our Flatter Glide Path Balances Multiple Risks
Constructing a glide path is not as simple as aiming for the highest growth. That's because doing so potentially ignores the other risks in long-term investing. And it creates a wider range of potential outcomes that could result in a larger probability of failure in retirement.
In contrast, American Century Investments' glide path design seeks to balance the multiple risks participants face when investing for retirement. These risks must be managed as they change in relative importance during the target-date life cycle and through various market environments.
The result is a more moderate, flatter glide path, which aims to keep more participants on course throughout their journey to and through retirement.
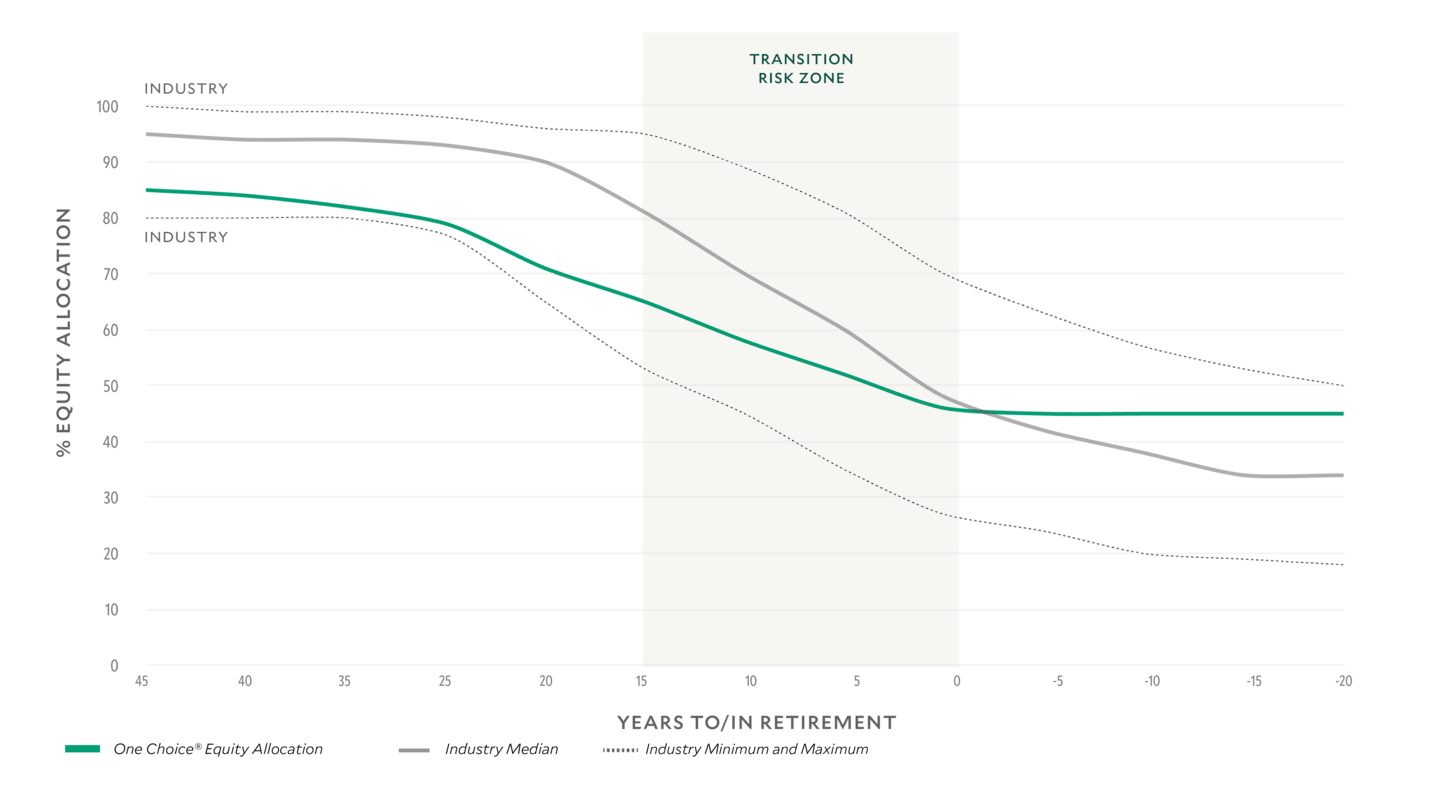
Source: American Century Investments®.
The industry median glide path represents the 50th percentile equity allocation among funds in the Morningstar Target-Date universe. The industry max and min represent the equity allocation among funds in the Morningstar Target-Date universe.
Moderate equity allocations in the accumulation years.
Historically, index returns of an 85% stock/15% bond portfolio earned 95% of the gains of an all-stock portfolio with only 86% of the risk.2
Flatter glide path during the "transition risk zone."
The 15-year period before retirement is arguably the most critical time for retirement investing. That's because account balances are highest near retirement, so a downturn here is particularly painful.
Optimal equity allocation at retirement.
We believe a 45% equity allocation at retirement balances growth risk versus market risk.
² Source: FactSet. Based on annualized returns and standard deviation of a portfolio consisting of 85% Russell 1000 Index/15% Bloomberg U.S. Aggregate Bond Index. The all-stock portfolio is represented by the Russell 1000 Index. Annualized data from 12/31/1983 to 3/31/2024
The Importance of the Transition Risk Zone
Glide path design involves more than just the level of equity allocation—the rate at which equity decreases is important too. We know that a shock—an unexpected job loss or significant market event—could jeopardize savings plans just when participants have the most to lose and the least amount of time to recover.
In contrast to our flatter, moderate approach, steep glide path descents in the transition risk zone have a higher probability of locking in losses for participants near retirement.
Participants Ages 50+ Typically Have the Most to Lose
Growth of a hypothetical participant's retirement savings from age 25 to 65. Assumptions: starting salary $45,000, growing at 2% per annum. Contribution rate fixed at 10% of salary each year. Annual portfolio return of 6.5% per year. This hypothetical situation contains assumptions that are intended for illustrative purposes only and are not representative of the performance of any security. There is no assurance similar results can be achieved, and this information should not be relied upon as a specific recommendation to buy or sell securities.
³ Source: American Century Investments.
⁴ Source: FactSet, S&P 500 Index Returns. Average returns 1/1/1929 - 12/31/2023.
⁵ Source: 2023 Transamerica Center for Retirement Studies "Life in Retirement: Pre-Retiree Expectations and Retiree Realities."
The Unforgiving Math of Recovery
Participants close to or in retirement may not have enough time to recover from a market shock. This hypothetical example illustrates how larger losses can pose a significant drag on longer-term performance. That's because portfolios must generate exponentially higher returns just to recover from the losses.
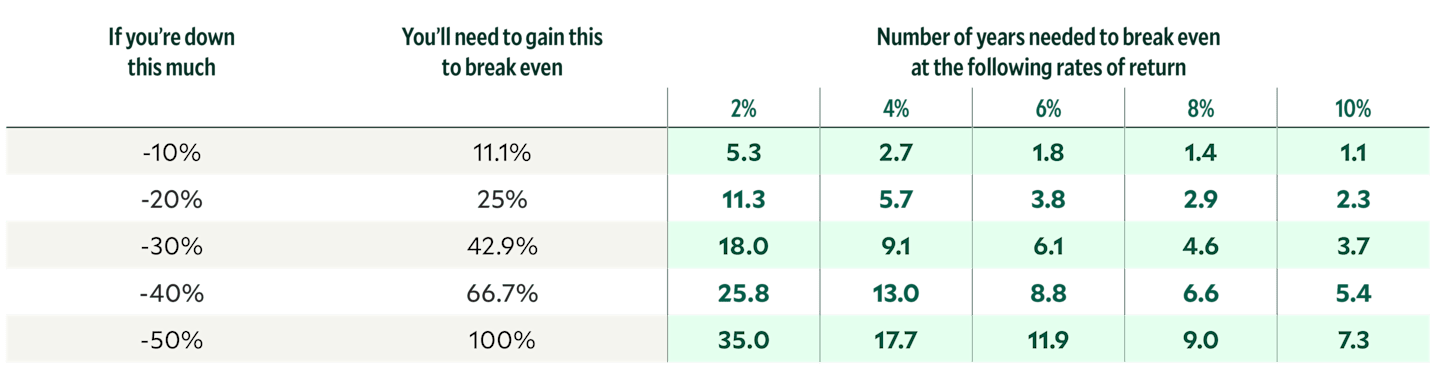
Hypothetical illustration. Results not intended to represent any actual investment strategy.
Focuses on Providing Better Outcomes for Tomorrow
When the goal is to provide more retirees with retirement savings to last a lifetime, short-term performance is not an accurate indicator of a portfolio's long-term outcome. Rather, it's also about keeping participants on course through the market's ups and downs.
We believe that risk management not only helps participants stay confidently invested in their portfolio, but also is a key factor in overall asset accumulation.
One Choice Stands Out® Over a Full Market Cycle
One Choice Target Date Portfolios' more moderate approach historically has performed as designed over a full market cycle, which is defined as a timespan including both a bull and a bear market.
Again, it's math—by losing less in down markets, such as the Financial Crisis, and pursuing responsible growth in up markets, the portfolio has provided better overall asset accumulation than the more aggressive strategy shown below.
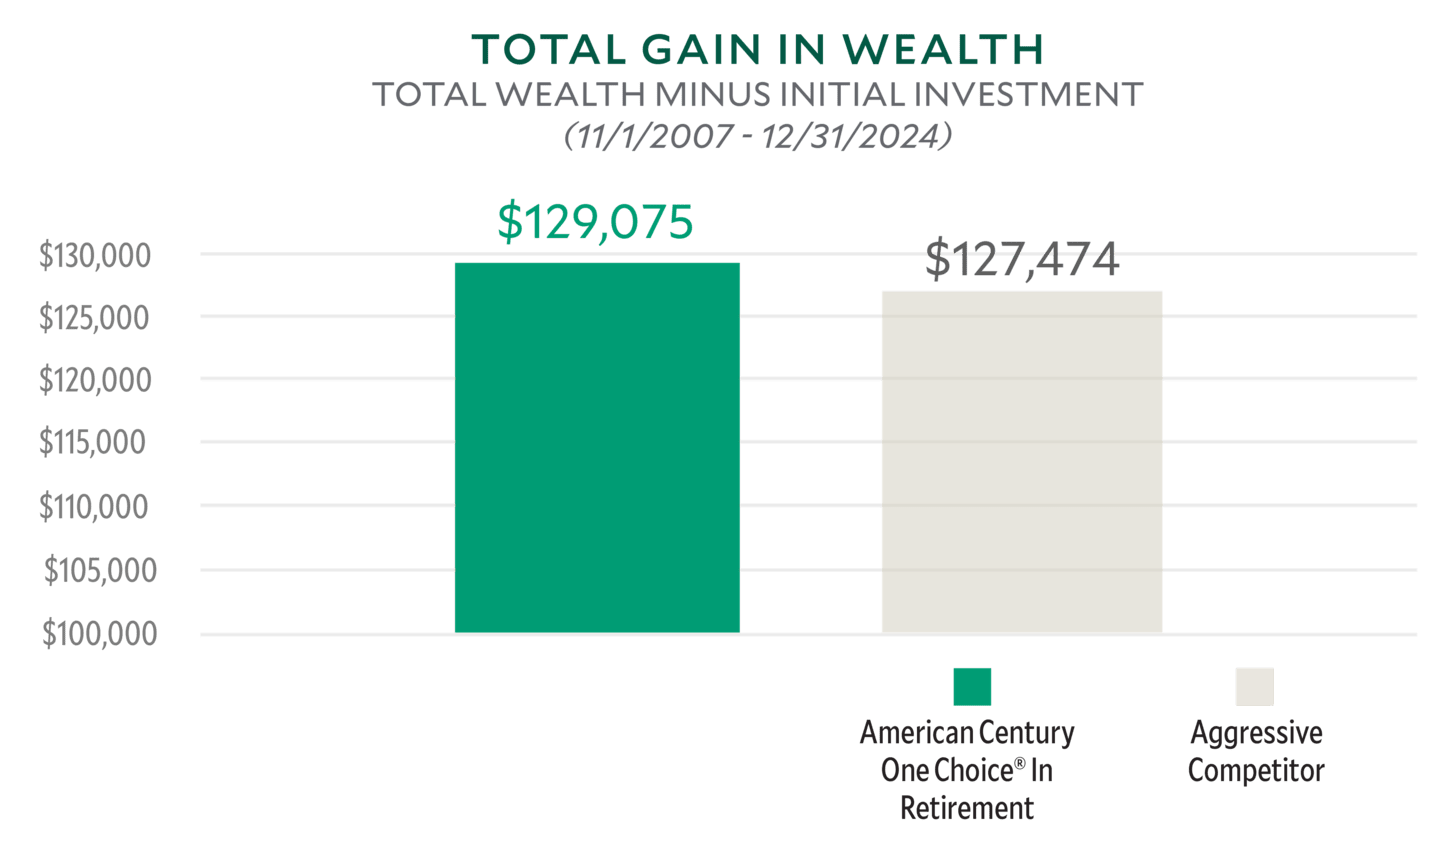
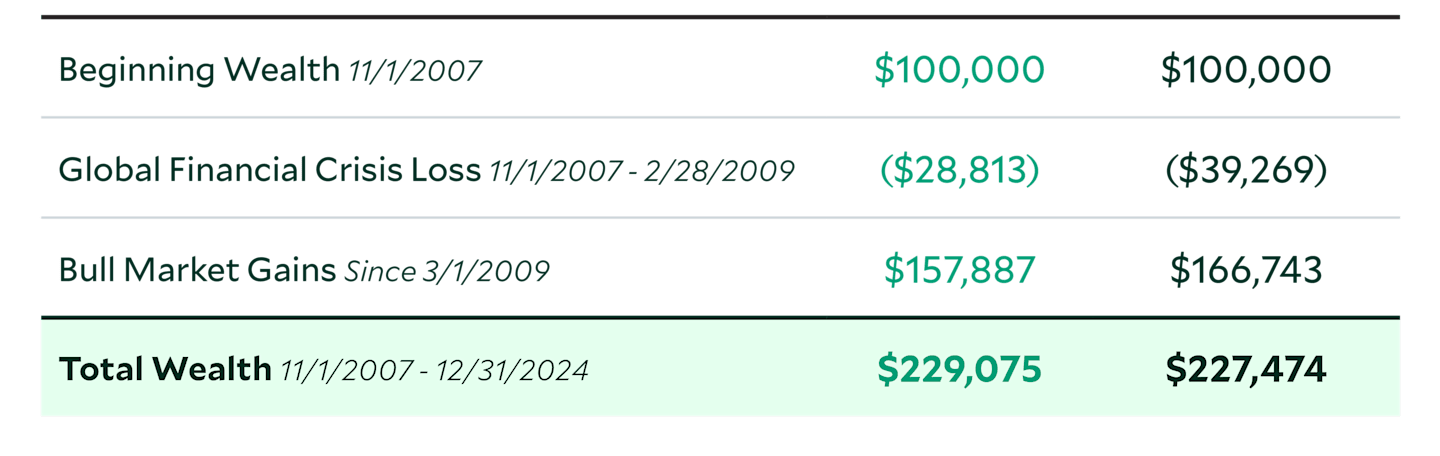
One Choice is represented by the American Century One Choice In Retirement I Fund. One Choice 2015 merged with One Choice In Retirement effective 3/27/2015. The Aggressive Target Date Fund (TDF) is represented by American Funds 2015 Trgt Date Retire R5. Data presented reflects past performance. Past performance is no guarantee of future results.
The analysis assumes a $100,000 starting balance and tracks the performance of the two products from the beginning of the Financial Crisis to the most recent quarter-end.
As you can see in this example, our risk-aware approach resulted in better participant outcomes than an aggressive target date over a full market cycle.
More gains in wealth with less volatility over a full market cycle.
11/1/2007 - 12/31/2024
8.61% Standard Deviation vs. 9.33% for an Aggressive Target Date Fund
11/1/2007 - 12/31/2024
Standard deviation is a measure of risk or volatility. Because the One Choice Target Date Portfolio has a lower standard deviation, it experienced less volatility during this period than the aggressive competitor.0.43 Risk-Adjusted Return (Sharpe Ratio) vs. 0.40 for an Aggressive Target Date Fund
11/1/2007 – 12/31/2024
Risk-adjusted returns, such as Sharpe ratio, account for the amount of risk taken to achieve the returns. Because the One Choice Target Date Portfolio has a higher Sharpe ratio, it means that for every unit of risk taken, it gained a higher return when compared to the aggressive competitor.52.19% Downside Capture vs. 55.82% for an Aggressive Target Date Fund
11/1/2007 - 12/31/2024
Downside capture is a measurement of an investment's relative performance versus its benchmark in down markets. Down markets are defined as periods where the S&P 500 returns are negative. Because the One Choice Target Date Portfolio has a lower downside capture ratio, it means that it experienced less loss versus the benchmark than the aggressive competitor over the same period.
Source: American Century Investments, FactSet and Morningstar. Data as of 12/31/2024. One Choice is Represented by One Choice In Retirement Portfolio, Class I. One Choice 2015 merged with One Choice In Retirement effective 3/27/2015. Data presented reflects past performance. Past performance is no guarantee of future results. The Aggressive Target Date Fund (TDF) is represented by American Funds 2015 Trgt Date Retire R5.
Aligned with Plans Seeking a Risk-Balanced Approach
Selecting the right target date strategy is a critical decision for plan sponsors and their consultants. Plan populations differ in many ways, including savings levels, demographics and risk appetites.
Given the ups and downs of financial markets and a natural aversion to losses, it's not surprising that two-thirds of plan sponsors and participants prefer an approach that prioritizes protection from loss over growth potential.
Determining Fit—Prudence Looks for Process
The DOL has given fiduciaries guidance on the selection and monitoring of a target-date strategy to meet safe harbor status and reduce the potential for litigation. The department’s Tips for ERISA Plan Fiduciaries clearly states the importance of documentation that the Qualified Default Investment Alternative (QDIA) selection aligns with a plan’s objectives and demographics.
Regardless of the product that you choose, case law shows the courts look for documentation that a prudent process was followed and decisions were made with the best interest of plan participants in mind.
Staying True to Fit is the Right Strategy for Clients
Target-date selection should be focused on the "right fit" for the most participants, which means evaluating all types of target-date approaches. One Choice Target Date Portfolios' approach may meet the needs of those seeking a more moderate solution.

plan sponsors and almost half of participants prefer a target date approach that prioritizes protection from losses over growth potential.
American Century Greenwald Retirement Survey 2024.
Hear Straight Talk from the Investment Team
Weekly Updates from Rich Weiss, CIO
Every Monday, American Century Investments hosts a call with CIO Rich Weiss, where he addresses the latest news—offering his insights and color commentary on the economy, markets and portfolio positioning.
For Professional Use Only.
Need Help Finding the Right Target-Date Strategy?
Find out if a moderate or more aggressive target-date strategy is better suited for your plan.
Target-Date Blueprint is an online tool designed to help you apply a prudent process to identify the right QDIA solution for each plan. Narrow the target-date universe to focus on only those with appropriate investment profiles aligned.
Let’s Talk Target Dates
Contact your Regional Retirement Specialist.
Portfolios
Explore One Choice® Target Date Portfolios. Select the target year to view fund details based on your goal date or view all our funds.
Let’s Talk Target Dates
Contact your Regional Retirement Specialist.
Additional Disclosures:
Target-Date Fund | Fund Ticker | Net Expense Ratio % | Gross Expense Ratio % | 5-yr Standard Deviation % | 1-yr Total Return USD | 5-yr Total Return USD | 10-yr Total Return USD | 15-yr Total Return USD | 20-yr Total Return USD | Inception Date |
|---|---|---|---|---|---|---|---|---|---|---|
American Century One Choice® In Retirement I* | ATTIX | 0.56 | 0.62 | 9.91 | 7.75 | 4.76 | 4.97 | 6.10 | 5.40 | 8/31/ |
American Funds 2015 Target Date Retire R5 | REJTX | 0.35 | 0.35 | 9.28 | 8.39 | 5.22 | 5.50 | 6.70 | - | 2/1/ |
Russell 1000 TR USD | - | - | - | 18.64 | 24.51 | 14.28 | 12.87 | 13.79 | 10.39 | 1/1/ |
Bloomberg US Agg Bond TR USD | - | - | - | 6.42 | 1.25 | -0.33 | 1.35 | 2.37 | 3.01 | 7/7/ |
American Century One Choice In Ret Inv* | ARTOX | 0.76 | 0.80 | 9.94 | 7.54 | 4.56 | 4.76 | 5.89 | 5.19 | 8/31/ |
Data through 12/31/2024. Returns greater than one year are annualized. Source: FactSet, Morningstar.
Data reflects past performance. Past performance is no guarantee of future results.
Current performance may be higher or lower than the performance shown. To obtain performance data current to the most recent month end, please visit www.americancentury.com/performance. Investment return and share value will fluctuate, and redemption value may be more or less than original cost. Data assumes reinvestment of dividends and capital gains.
All funds: Daily Liquidity. Principal not guaranteed. The tax consequences of owning shares of the funds will vary depending on whether you own them through a taxable or tax-deferred account. Tax consequences result from distributions by the funds of dividend and interest income they have received or capital gains they have generated through their investment activities. Tax consequences also may result when investors sell fund shares after the net asset value has increased or decreased. The fund’s prospectus contains this and other information and should be read carefully before investing.
Target date funds are designed to provide a comprehensive and broadly diversified investment solution for an investor planning to retire or start withdrawing their money in the target year of the fund. The target year is intended as a general guide and does not necessarily represent the exact year portfolio assets will be used. The fund is a "fund of funds," meaning that it seeks to achieve its objective by investing in other American Century Investments mutual funds. Over time, the asset mix and weightings are adjusted to become more conservative; the allocation to stocks will decrease, and the allocation to bonds and money market instruments will increase.
One Choice® In Retirement Portfolio maintains a constant asset mix designed to focus more on income than capital appreciation. It is intended for near- or in-retirement investors, or anyone seeking a conservative investment solution.
Each of the target-date funds follows a pre-set asset allocation schedule that’s specifically designed to provide the optimal trade-off of risk and reward potential based on the target date. The principal value of the fund(s) is not guaranteed at any time, including at the target date. A fund with a later target date is expected to be more volatile than one with an earlier target date.
Diversification does not ensure against a loss. The fund’s risks reflect those of the underlying investments. Market performance tends to be cyclical and if the market does not favor an underlying fund’s style, that fund may suffer sharp declines as a result of earnings disappointments or other market or economic events.
The information is not intended as a personalized recommendation or fiduciary advice and should not be relied upon for investment, accounting, legal or tax advice.
The performance of the portfolios is dependent on the performance of their underlying American Century Investments' funds and will assume the risks associated with these funds. The risks will vary according to each portfolio's asset allocation, and a fund with a later target date is expected to be more volatile than one with an earlier target date.
The gross expense ratio is the fund's total annual operating costs, expressed as a percentage of the fund's average net assets for a given time period. It is gross of any fee waivers or expense reimbursement. The net expense ratio is the expense ratio after the application of any waivers or reimbursement. This is the actual ratio that investors paid during the fund's most recent fiscal year. Please see the prospectus for more information.
*Returns or yields for the fund would be lower if a portion of the management fee had not been waived. The advisor expects this waiver to continue until November 30, 2025, and cannot terminate it prior to such date without the approval of the Board of Directors. Review the prospectus report for the most current information.
Risk-adjusted returns, in financial literature, are investment returns that are not just measured for their absolute magnitude over time. They are also measured for the amount of risk that was used to achieve them, and the potential impact of that risk on returns over time. The philosophy behind measuring risk-adjusted returns is to better understand and predict both upside potential and downside risk from investments based on the amount of risk that is used to achieve their returns.
Sharpe Ratio represents the amount of return (reward) earned per unit of risk from an investment. Portfolios with higher Sharpe Ratios tend to provide more return for the same amount of risk as portfolios with lower Sharpe Ratios.
Downside Capture Ratio is a measure of an investment's performance in bear markets relative to its benchmark. It shows the amount of losses that a manager experienced during a down market.
Standard deviation is a statistical measurement of variations from the average. In financial literature, it's often used to measure risk, when risk is measured or defined in terms of volatility. In general, more risk means more volatility, and more volatility means a higher standard deviation-there's more variation from the average of the data being measured. In this context, reducing risk means seeking lower standard deviation.
The Russell 1000® Index is a market-capitalization weighted, large-cap index created by Frank Russell Company to measure the performance of the 1,000 largest publicly traded U.S. companies, based on total market capitalization.
The Bloomberg U.S. Aggregate Bond Index represents securities that are taxable, registered with the Securities and Exchange Commission, and U.S. dollar-denominated. The index covers the U.S. investment-grade fixed-rate bond market, with index components for government and corporate securities, mortgage pass-through securities, and asset-backed securities.
©2025 Standard & Poor's Financial Services LLC. All rights reserved. For intended recipient only. No further distribution and/or reproduction permitted. Standard & Poor's Financial Services LLC ("S&P") does not guarantee the accuracy, adequacy, completeness or availability of any data or information contained herein and is not responsible for any errors or omissions or for the results obtained from the use of such data or information. S&P GIVES NO EXPRESS OR IMPLIED WARRANTIES, INCLUDING, BUT NOT LIMITED TO, ANY WARRANTIES OF MERCHANTABILITY OR FITNESS FOR A PARTICULAR PURPOSE OR USE IN CONNECTION TO THE DATA OR INFORMATION INCLUDED HEREIN. In no event shall S&P be liable for any direct, indirect, special or consequential damages in connection with recipient's use of such data or information.
©2025 Morningstar, Inc. All Rights Reserved. Certain information contained herein: (1) is proprietary to Morningstar and/or its content providers; (2) may not be copied or distributed; and (3) is not warranted to be accurate, complete or timely. Neither Morningstar nor its content providers are responsible for any damages or losses arising from any use of this information.