What’s Driving Our High Conviction Toward High-Yield Bonds?
Although the U.S. economy will likely slow, the high-yield market may offer opportunities due to its resilient fundamentals.

Key Takeaways
In our view, slower yet positive economic growth can create a supportive backdrop for high-yield bonds’ performance potential.
Yields remain relatively high and attractive versus other sectors, boosting the asset class’s total return potential.
While high-yield credit spreads are historically tight, market fundamentals and technical influences drive our optimism for high-yield securities.
High-Yield Bond Yields Help Drive Solid Return Potential
We believe the yields available in the high-yield bond market may position the asset class for attractive return potential.
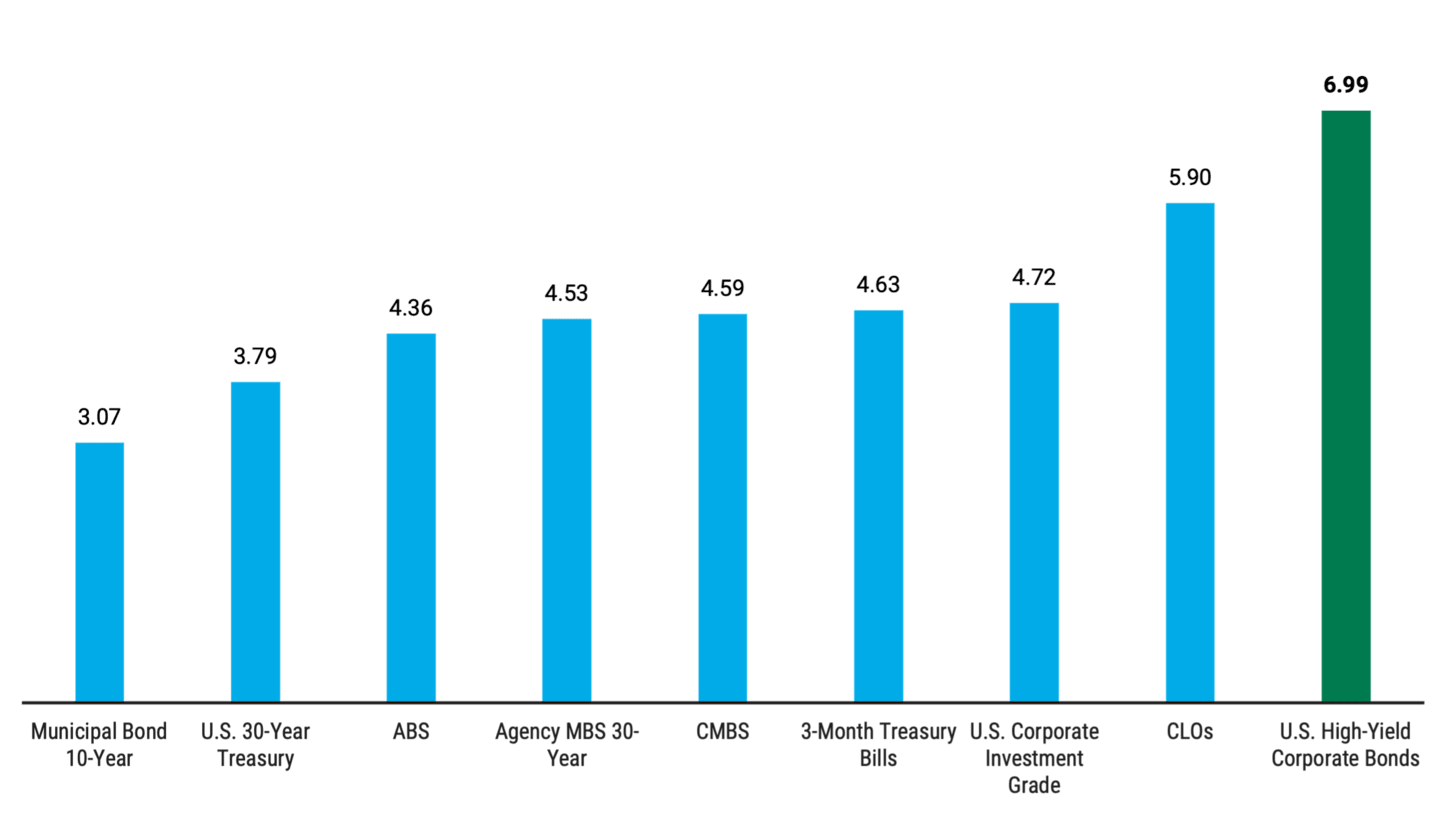
As of September 30, the yield on the Bloomberg U.S. Corporate High-Yield Bond Index was 6.99%. This compares favorably to the yields in other fixed-income sectors, which are typically more sensitive to Federal Reserve (Fed) policy. See Figure 1.
Figure 1 | High-Yield Bonds Have Offered Comparatively Attractive Yields
Yield-to-Maturity (%)

Data as of 9/30/2024. Source: FactSet, JPMorgan, Morningstar, American Century Investments. The following terms referenced in the chart are defined in our glossary: agency mortgage-backed securities (MBS), asset-backed securities (ABS), collateralized loan obligations (CLOs), commercial mortgage-backed securities (CMBS), high-yield corporate bonds, investment grade, Treasury bill and yield to maturity. ABS represented by the Bloomberg U.S. Aggregate Securitized ABS Index, a subset of the Bloomberg U.S. Aggregate Bond Index that tracks ABS; agency MBS 30-year represented by the Bloomberg U.S. MBS (30-Year) Index, a subset of the Bloomberg U.S. MBS Index tracking longer-maturity securities: CMBS represented by the Bloomberg U.S. Aggregate Securitized CMBS Index, a subset of the Bloomberg U.S. Aggregate Bond Index that tracks CMBS; CLOs represented by the J.P. Morgan CLOIE, an index that tracks U.S. debt from broadly-syndicated, arbitrage floating-rate CLOs.
High-Yield Issuers’ Financials Remain Encouraging
Despite periods of interest rate volatility and signs of a slowing economy, we believe high-yield issuers’ financials generally remain resilient:
High-yield issuers’ operating earnings have been relatively healthy in recent quarters. Second-quarter 2024 operating earnings were up 15% quarter-over-quarter, fending off signs of a slowing economy and amplified rate volatility.1
High-yield companies have generated positive cash flows internally, and our research shows that they are using these resources to help shore up their balance sheets.
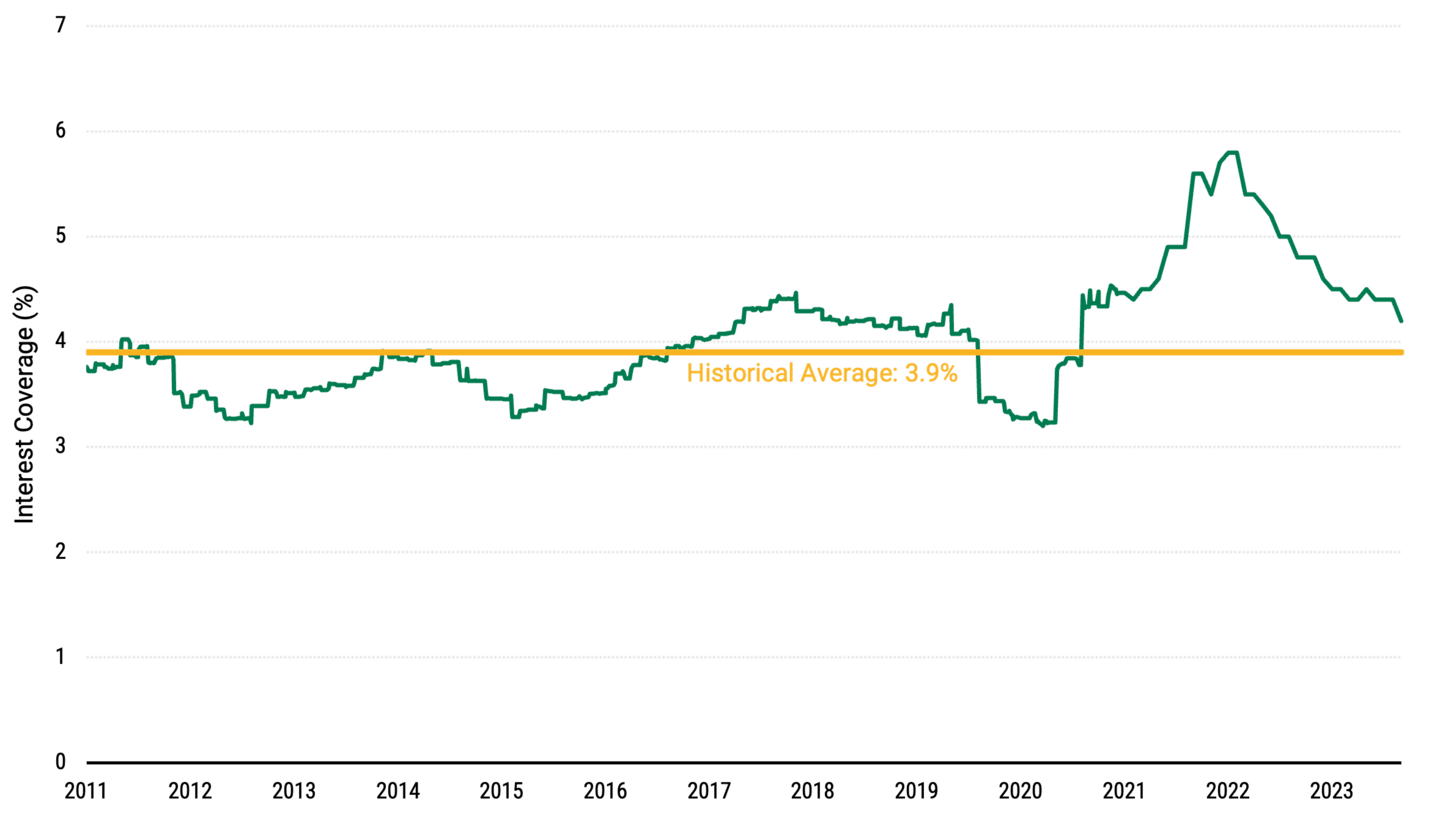
Interest coverage, which indicates an issuer’s ability to make timely interest payments to bondholders, has slightly weakened compared with last year. Nevertheless, it remains well-positioned versus historical levels, as Figure 2 illustrates.
Figure 2 | Interest Coverage Trends in the U.S. High-Yield Market
A Higher Percentage Shows Stronger Financial Health

Data as of 8/31/2024. Source: Bank of America.
Stable Default Rates in High-Yield Market
The high-yield market’s default rate was 1% for the 12-month period ending in August, according to Bank of America research. Although we expect softer economic growth, we don’t think defaults will rise much over the next 12 months.
Our view is based on issuers’ stronger balance sheets and an evolution toward higher credit quality within the investable universe. As of August 31:
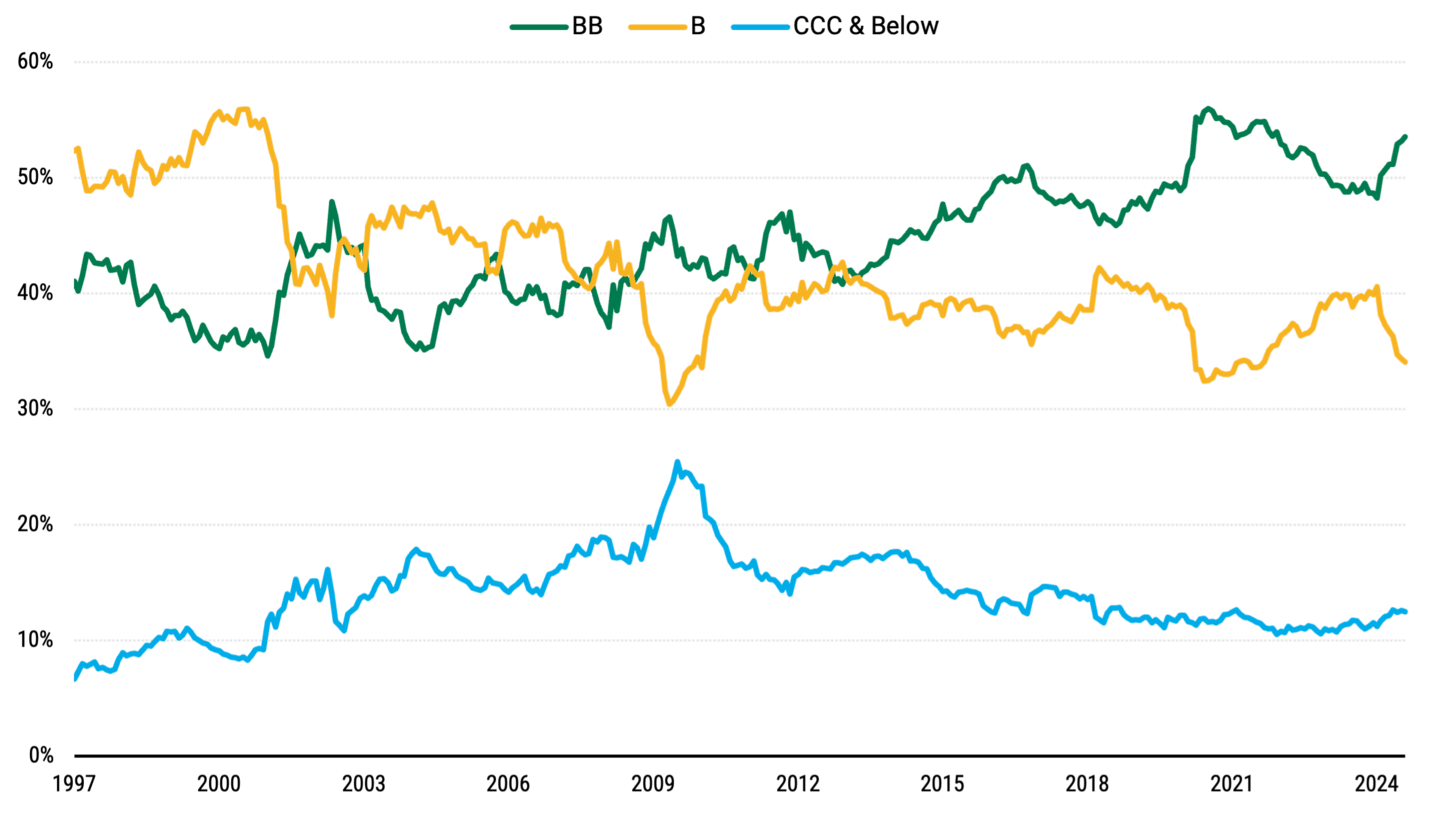
Fifty-three percent of the high-yield market (ICE BofA U.S. High Yield Constrained Index) was rated BB, the asset class’s highest rating.* See Figure 3.
Less than 7% of the market (ICE BofA U.S. High Yield Constrained Index) traded at distressed levels (at spreads of more than 1,000 basis points).
Together, we believe these factors suggest default rates will remain low going forward.
Figure 3 | Credit Rating Distribution in High-Yield Bonds
Distribution by Rating of the ICE BofA U.S. High Yield Constrained Index

Data as of 8/31/2024. Source: ICE Bank of America U.S. High Yield Constrained Index.
Technical Tailwinds Support High-Yield Bonds
Although spreads in the high-yield market are tight, technical factors contribute to our positive outlook:
Supply/demand: A $100 billion decline in bonds outstanding in 2022 and 2023 aided the supply/demand dynamic. Positive imbalances between rising-star upgrades and fallen-angel downgrades created this scenario.2
Market size: In the first eight months of 2024, the high-yield market expanded by a manageable $45 billion. Rising stars only modestly outpaced fallen angels, mitigated by solid inflows for the asset class.3
Issuance: While net new issuance has been light, gross issuance has been robust, totaling more than $200 billion, as companies lock in tight spreads to refinance upcoming maturities.4
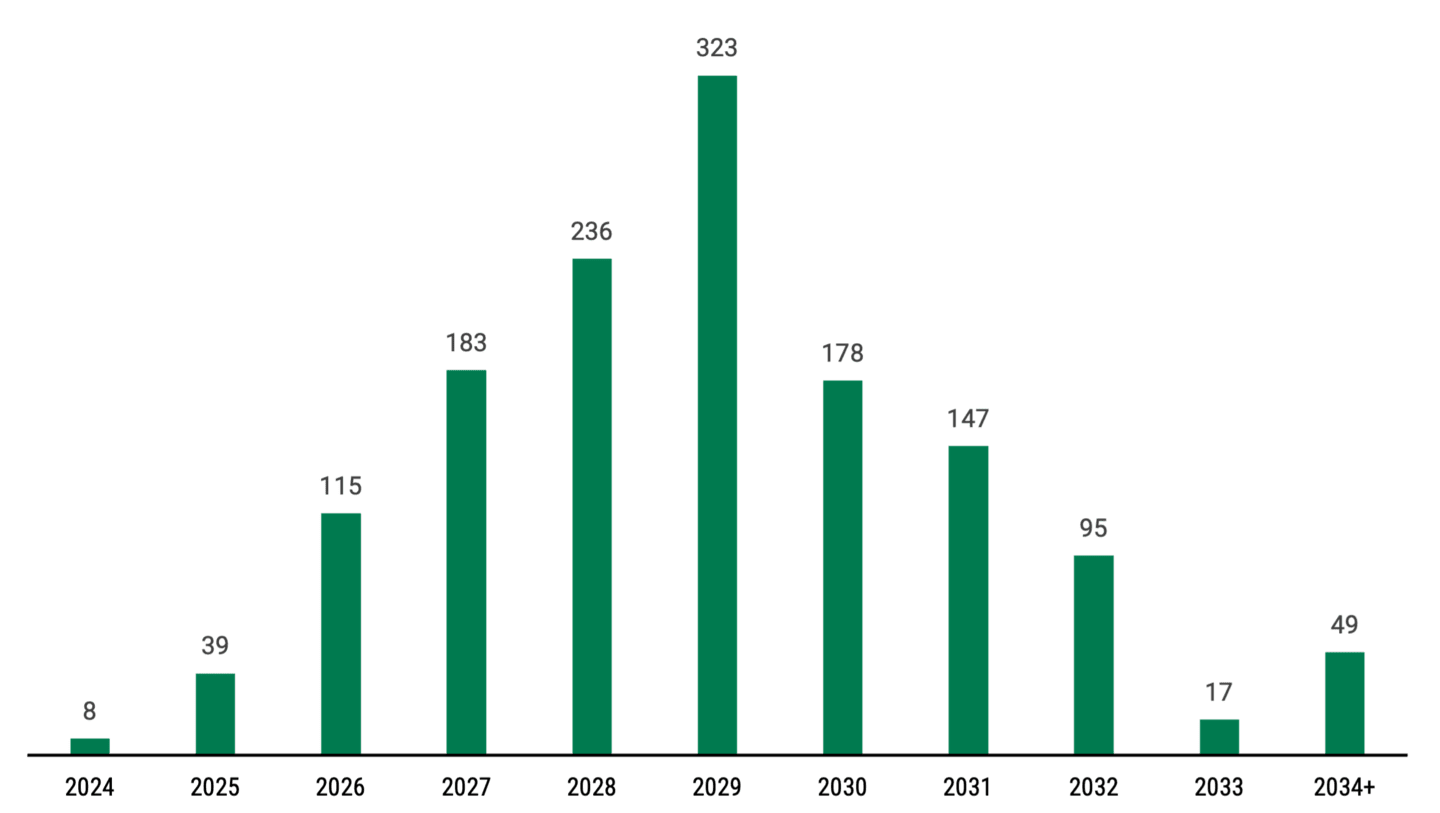
Maturity wall: The high-yield market’s maturity wall (the maturity schedule for the broad market) will be low until 2027, as shown in Figure 4. In fact, less than 12% of the total U.S. high-yield debt will mature through 2026, as Figure 4 indicates.
Figure 4 | Maturity Profile of U.S. High-Yield Bonds
Maturities ($ Billions)

Data as of 8/31/2024. Source: Bank of America.
Finding Opportunities in High-Yield Bonds Amid an Economic Slowdown
A slow but still positive economy may enable high-yield issuers to broadly maintain profitability and cash flow. At the same time, we believe a growth slowdown should also support continued Fed easing.
Of course, some spread widening will occur if growth slows at a steeper-than-expected pace. However, the same economic softening pushing spreads wider may potentially prompt the Fed to cut rates more aggressively. In our view, such a scenario could mitigate the effects on high-yield bonds.
Our expectations for a slow-growth economy underscore our preference for more defensive positioning. We generally favor increasing allocations to less economically sensitive sectors, such as health care and utilities.
Also, a slowing economy could lead to credit complications for some issuers. We would view this scenario as an opportunity to boost performance potential in the current pricing environment.
Today, the average high-yield bond price is discounted, hovering below the post-Financial Crisis median.5 Finding discounted bonds with improving credit and market-risk profiles offers solid price appreciation potential, in our view.
Authors
Explore Our Global Fixed Income Capabilities
The letter ratings indicate the credit worthiness of the underlying bonds in the portfolio and generally range from AAA (highest) to D (lowest).
JPMorgan.
Rising stars refer to bonds with credit-rating upgrades that push them into the investment-grade market; fallen angels refer to bonds with credit-rating downgrades that push them into the high-yield market.
Nomura.
Nomura.
Nomura, as of 9/30/2024.
This document is prepared by Nomura Corporate Research and Asset Management Inc. (NCRAM) and is for informational purposes only.
An investment in high-yield instruments involves special considerations and certain risks, including credit risk, liquidity risk, default risk and price volatility, and such securities are regarded as being predominantly speculative as the issuer’s ability to make payments of principal and interest.
The views and estimates expressed in this material represent the opinions of NCRAM and are subject to change without notice and are not intended as a forecast or guarantee of future results. Such opinions are statements of financial market trends based on current market conditions. The views and strategies described may not be suitable for all investors. This material has been prepared for informational purposes only, and is not intended to provide, and should not be relied upon as legal or tax advice.
Mutual Funds: American Century Investment Services, Inc., Distributor.
Investment return and principal value of security investments will fluctuate. The value at the time of redemption may be more or less than the original cost. Past performance is no guarantee of future results.
Generally, as interest rates rise, the value of the bonds held in the fund will decline. The opposite is true when interest rates decline.
The opinions expressed are those of American Century Investments (or the portfolio manager) and are no guarantee of the future performance of any American Century Investments' portfolio. This material has been prepared for educational purposes only. It is not intended to provide, and should not be relied upon for, investment, accounting, legal or tax advice.
Exchange Traded Funds (ETFs): Foreside Fund Services, LLC - Distributor, not affiliated with American Century Investment Services, Inc.