Stocks Are the True Independents in This Election
Election results don’t drive financial market outcomes over time.


Key Takeaways
Presidential elections often lead to volatility in the markets. But “betting” on a political outcome is difficult and potentially costly.
Markets have tended to rise regardless of presidential election results, so it has typically paid to stay invested long-term rather than trying to time the market.
Stick to your saving and investing plan despite short-term volatility caused by political, economic and market conditions. A balanced approach is key.
Trump vs Harris: What does the U.S. presidential election mean to financial markets?
Holding a presidential election when emotions are running high, and the political divide seems wider than ever feels momentous. After all, the selection of a particular candidate or political party can result in significant changes to economic, social and environmental policies that affect industries or market sectors.
But election results don’t drive financial market outcomes over time, so trying to time your investments around elections doesn't pay. Neither does positioning your portfolio based on expected outcomes. You may have heard that one party is good or bad for stocks in general or particular industries. Based on the data, we haven’t seen that the conventional wisdom holds true over time.
We believe your saving and investing behavior should drive your financial success — developing and sticking to a long-term plan.
The political party controlling 1600 Pennsylvania Ave. isn’t likely to affect your retirement needs or the amount of money you save for a down payment on a home. The levers you can pull to improve your chances of enjoying a fully funded retirement or financing a college education for a loved one exist independently of the party in office.
We understand the anxiety you may be feeling as we approach the election. It’s natural, and it’s real. Figure 1 shows that market volatility increases near the time of the Democratic and Republican party national conventions through Election Day. But this volatility has historically subsided just as quickly after the election.
Figure 1 | Volatility Generally Elevates Up to the Election and Begins to Subside Post-Election Once Election Uncertainty Dissipates
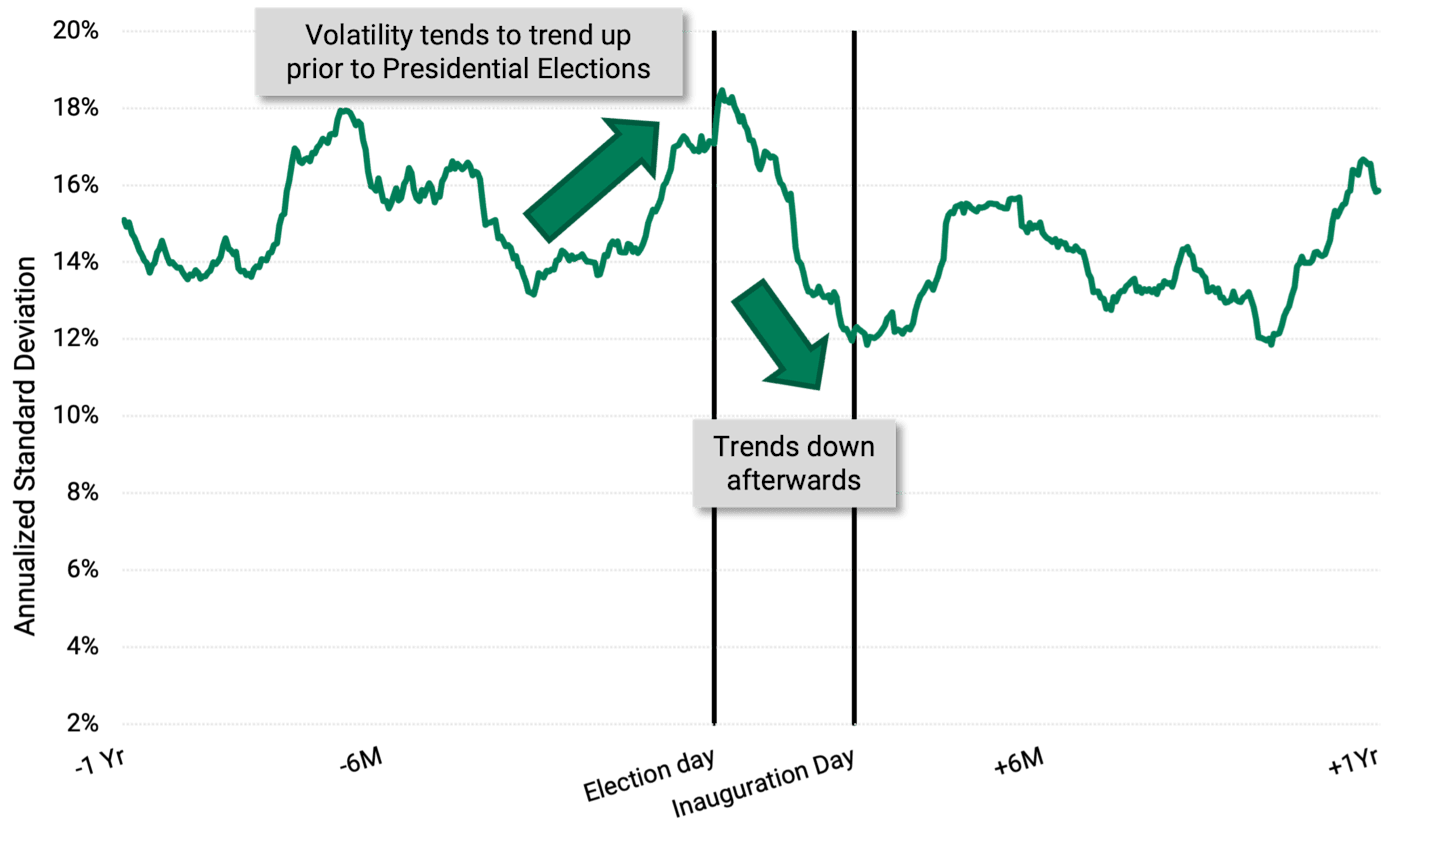
Data from 11/6/1931 – 11/3/2021. Source: FactSet, U.S. National Archives, Library of Congress, American Century Investments. Average annualized standard deviation of rolling 30-day S&P 500 Index price returns for 23 periods (23 elections since 1932). Time period of 1 year before election date through 1 year after election date.
If we widen our lens to look at market volatility in the years before and after presidential elections, we find that volatility stayed in the same general range. If electoral outcomes had huge impacts on markets, we would expect to see some big divergence or changes. We just don’t see evidence that electoral outcomes move markets.
Some investors might look at Figure 1 and conclude they could gain something by trading out of markets around elections and getting back in later. Our analysis shows, however, that it’s best to maintain a consistent approach by staying focused on your investment goals and not jumping in and out of the market. Figure 2 shows returns for different trading strategies around presidential elections.
Figure 2 | The Election Anticipation Trade
“Betting” on politics and placing anticipation trades around presidential elections can be detrimental to long-term wealth
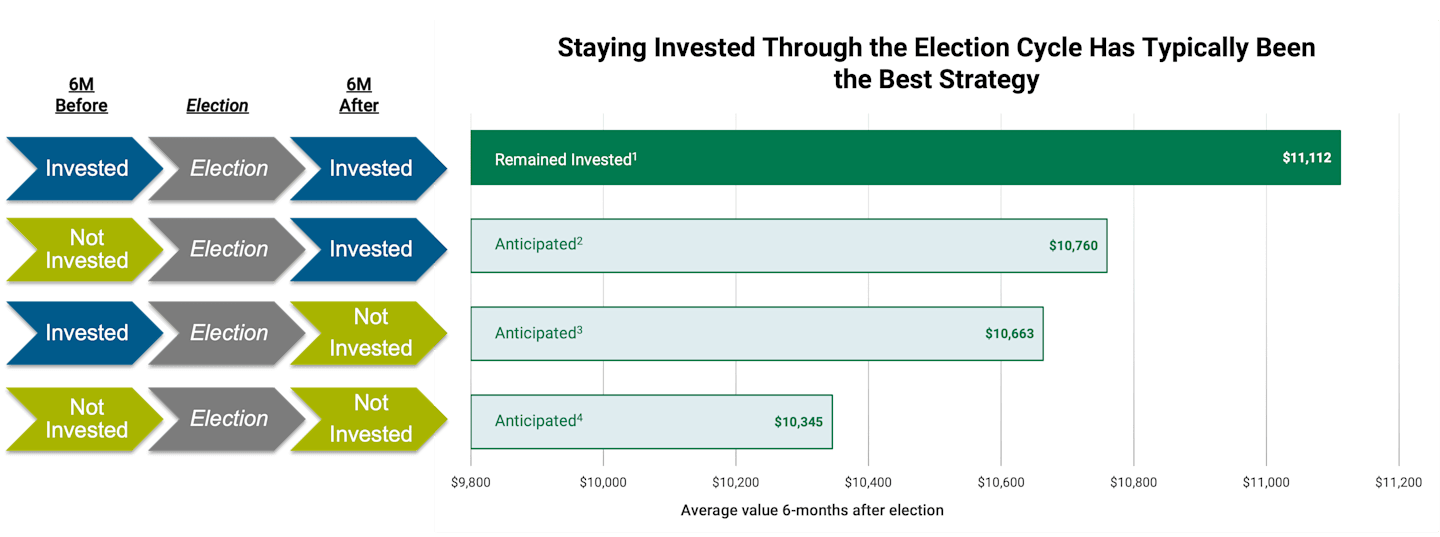
Data from 4/30/1932 – 12/31/2021. Source: FactSet, Ibbotson and Associates, Inc., U.S. National Archives, American Century Investments. Four hypothetical investor scenarios were analyzed for each Presidential Election since 1932. Each investor invests $10,000 six months before the Presidential Election and either remains invested in stocks or in cash for the six months before and the six months after the election. Past Performance Is No Guarantee of Future Results.
¹Remained Invested: Hypothetical investor remains fully invested in stocks six months leading up to the election, during November and six months after the election.
²Anticipated: Hypothetical investor keeps $10K in cash the six months leading up to the election, during November and rotates to be fully invested in stocks for the six months after the election.
³Anticipated: Hypothetical investor is invested in stocks the six months leading up to the election, during November and rotates to be fully in cash for the six months after the election.
⁴Anticipated: Hypothetical investor keeps $10K in cash the six months leading up to the election, during November and six months after the election.
This hypothetical situation contains assumptions that are intended for illustrative purposes only and are not representative of the performance of any security. There is no assurance similar results can be achieved, and this information should not be relied upon as a specific recommendation to buy or sell securities.
Equities represented by the S&P 500 Price Return from 4/30/1932 – 12/31/2021. Cash represented by 1-month Treasury Bill returns from 4/30/1932 – 12/31/2021. Average ending values of 23 elections from 1932-2020 (4/30/1932 - 5/31/2021). 6M Before: May-October of election year. Election: November of election year. 6M After: December-May after election.
Markets have tended to go up much more often than they have tended to go down over time, so it’s better, on average, to be in the market. And because market gains often come in short, sharp jumps, being out of the market when these jumps occur could seriously affect your long-term returns. That's why the best result shown in Figure 2 was staying invested, while the worst result was staying out of the market for the longest period. Trading in or out around the election produced outcomes between the two extremes.
What’s likely to drive market returns in the short run?
As we’ve seen since late last year, rising and falling expectations for rate cuts by the Federal Reserve (Fed) are a significant source of volatility in the global markets. We believe this volatility will continue up to and beyond election day. Investors want to see continued economic resilience and clarity around Fed policy before they make corporate profits and other business fundamentals their primary investment considerations.
It's also important to note that the U.S. isn’t alone in electing new leadership in 2024. Voters in countries accounting for 60% of the world’s gross domestic product (GDP) will go to the polls.1 Each of these elections can potentially change the course of policy that affects the regulatory and operating environment for businesses.
Geopolitical tension hangs over the market as well. Beyond their tragic humanitarian impacts, the ongoing wars in Ukraine and Gaza remain threats to turn into broader conflicts that could ripple through the global economy.
So, what should I do about the election?
Our analysis suggests that investors who do best over the long haul stick to their plans and stay diversified, not try to time the market by trading in and out of asset classes.
Figure 3 demonstrates how performance and leadership vary across asset classes during election years. The only discernible pattern we see is that a balanced approach has delivered performance consistently in the middle of the pack, avoiding the big swings we see elsewhere.
Figure 3 | Balanced Approach Delivers More Dependable Returns, Regardless of the Party in Power
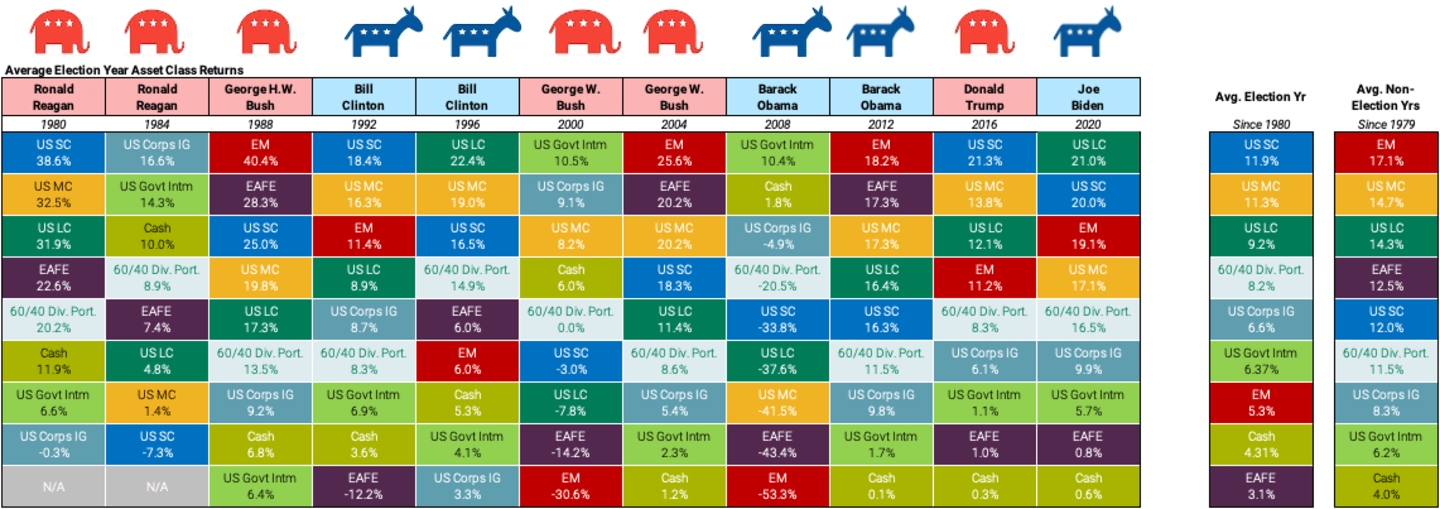
Data from 1/1/1979 – 12/31/2023. Source: FactSet, U.S. National Archives, American Century Investments. Annual index performance during U.S. Presidential Election years from 1980-2020. Past Performance Is No Guarantee of Future Results. Diversification does not assure a profit nor does it protect against loss of principal.
*60/40 Div. Port. Consists of 60% Russell 1000 Total Return Index and 40% Bloomberg U.S. Aggregate Bond Total Return Index.
Asset class returns since 1980 due to data history constraints. US SC (U.S. Small Cap) represented by Russell 2000 Total Return, US MC (U.S. Mid Cap) represented by Russell Mid Cap Total Return, US LC (U.S. Large Cap) represented by Russell 1000 Total Return, EAFE (Developed non-U.S. equities) represented by MSCI EAFE Net Return, Cash represented by FTSE 3-Month Treasury Bill, U.S. Gov. Intm represented by Bloomberg U.S. Government Intermediate, Corps (U.S. Investment Grade Corporate Bonds) represented by Bloomberg U.S. Corporate Investment Grade, EM (Emerging Markets) represented by MSCI Emerging Markets and starts 12/31/1987. For history, gross returns used from 12/31/1987 - 12/31/2000 and net returns used from 12/31/2000 - 12/31/2023. Avg. Election Year since 1980 is the average of 11 elections since 1980, Emerging Markets average begins 1988 due to lack of reliable data for 1980 and 1984. Avg. Non-Election Years since 1979 is the average of 34 non-election years since 1979, Emerging Markets average begins 1989 due to lack of reliable data until 1988.
Stay Focused on Your Financial Goals
We think this data helps clarify the difficulty of positioning your portfolio in anticipation of electoral outcomes. Betting on politics is hard and potentially costly, even if you pick the right candidate or political party. You must be correct in predicting the winning candidate and time trades perfectly and correctly foresee the winning candidate’s effect on the markets.
Don’t let election predictions or results impact your investment choices. We believe successful long-term investing relies on developing and sticking to your financial plan.
Author
Bank of America Securities, “BofA Global Research Calls 2024 the ‘Year of the Landing,’” November 27, 2023.
Past performance is no guarantee of future results. Investment returns will fluctuate and it is possible to lose money.
Diversification does not assure a profit nor does it protect against loss of principal.
The opinions expressed are those of American Century Investments (or the portfolio manager) and are no guarantee of the future performance of any American Century Investments' portfolio. This material has been prepared for educational purposes only. It is not intended to provide, and should not be relied upon for, investment, accounting, legal or tax advice.