Do Leading Economic Indicators Still Lead?
There is an epic disconnect between economic forecasts and economic outcomes.


Key Takeaways
The highly anticipated recession of 2023 didn’t materialize due to pandemic-related disruptions, which upended long-standing economic relationships.
The gap between current and leading economic indicators is crucial and can determine if there will be a soft landing, hard landing or none at all.
For investors, the punchline is that uncertainty remains high, and a number of potential outcomes remain possible. Diversification remains the watchword.
Discrepancy Between Economic Indicators and Realities
In 2023, a prominent brokerage house ran a report titled, “Dude, where’s my recession?” It captured the sentiment of analysts everywhere, flummoxed by the strength of the economy in the face of their own gloomy forecasts.
Here we look at one prominent economic forecasting tool — the Conference Board U.S. Leading Economic Index® (LEI) — and compare it to the Conference Board Coincident Economic Index® (CEI) to explore the disconnect. The LEI is an aggregation of 10 fundamental economic indicators meant to indicate the direction of the economy over the next several quarters. The CEI is a composite index that measures the current overall economic activity in an economy, incorporating key indicators like employment, industrial production, income, and sales.
As you can see from Figure 1, the LEI has done a perfect job predicting past downturns: Recession always ensued within six months of the leading indicator turning negative. This ultimately forced the CEI down also. This time, however, the LEI showed negative growth every month from February 2022 to February 2024, but the anticipated recession never arrived, keeping the CEI in positive territory.
Figure 1 | Large Gap Between Leading and Current Economic Indicators
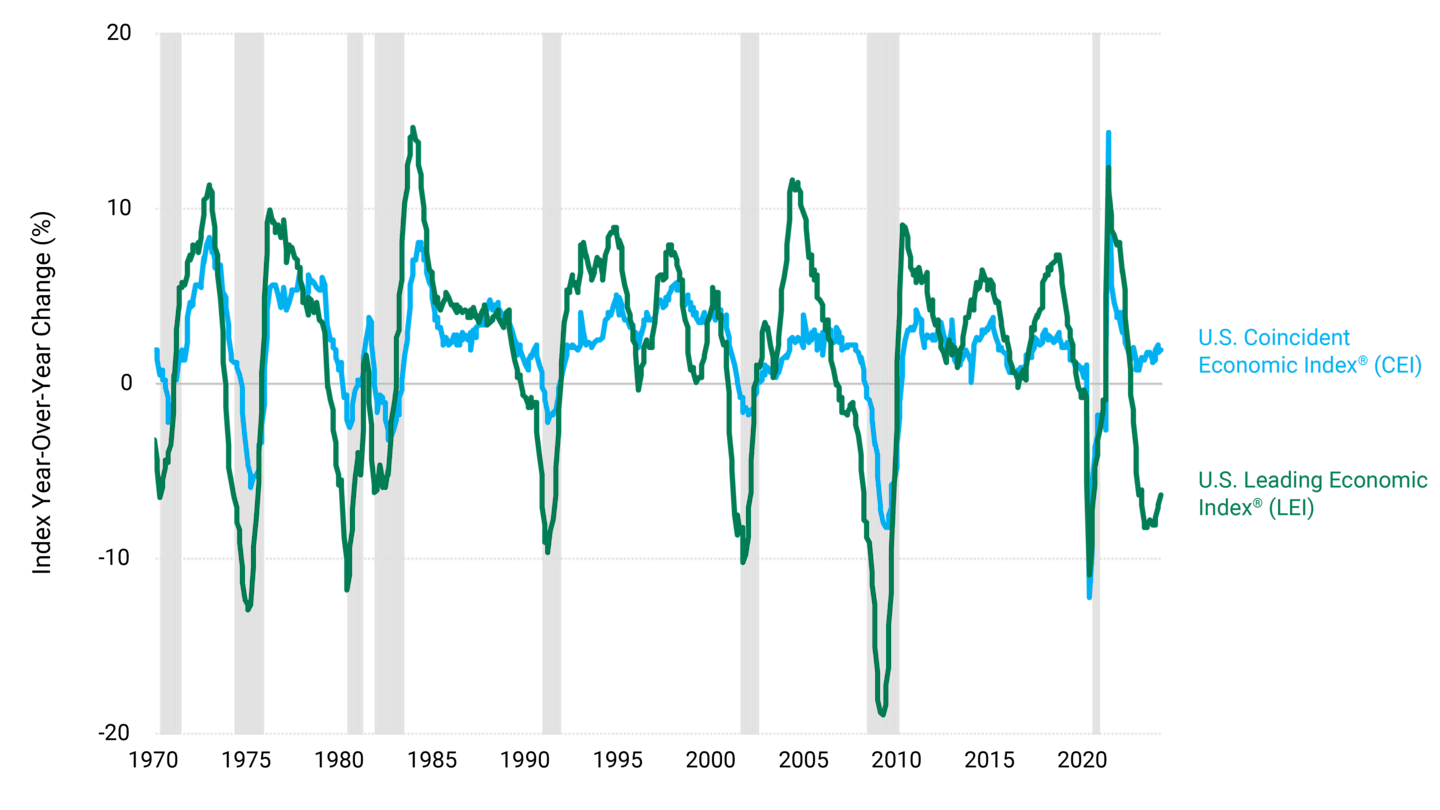
Data from 1/1/1970 - 3/31/2024. Source: FactSet.
Unraveling the Economic Cycle: From Pandemic Shock to Fed Reaction
First, let’s recap the series of remarkable events over the past four years to explain the disconnect between the data and the outcomes this time around.
COVID demand and supply shock. The COVID-19 virus and attempts to stop its spread caused severe disruptions to consumption and production. This directly precipitated the 2020 recession.
Massive fiscal and monetary pandemic response. In the U.S. alone, fiscal stimulus amounted to $5 trillion. By comparison, that’s three times the size of the stimulus package implemented during the 2008 Great Financial Crisis, inflation adjusted. Monetary policy also played a significant role in stimulating economies, with the Federal Reserve (Fed) reducing interest rates to zero and expanding its balance sheet from $4 trillion to $9 trillion, again dwarfing the expansion in the wake of 2008.
Supply chain disruptions. Those stimulus policies occurred alongside pandemic-related global supply chain breakdowns. These factors together resulted in the highest inflation in the U.S. since the 1970s oil shock.
Aggressive rate hikes. In response to galloping inflation, the Fed raised rates by 525 basis points from March 2022 to July 2023, the fastest pace in 40 years.
On paper, this reads like a textbook economic cycle. An economic downturn begets monetary and fiscal responses, which facilitate an economic recovery but also promote inflation. In turn, this forces the Fed to react by raising interest rates. The only thing missing from this progression is the logical next step — recession.
Dude, Where’s My Recession?
Let’s begin by recalling that higher interest rates work on the economy by destroying demand. Rising borrowing costs mean consumers and companies spend less, economic growth is less, and therefore upward pressure on prices (inflation) is less.
The difference this time is that these rate hikes come after more than a decade of exceptionally low interest rates. Homeowners, consumers and companies all took advantage of those low interest rates to lock in mortgages and other debt payments at low long-term rates. Indeed, Fed data show that household debt service payments as a percentage of disposable personal income are virtually unchanged today from the second quarter of 2022, when the Fed began its aggressive rate-hiking campaign.1
What’s more, earlier pandemic-era fiscal stimulus is still propping up consumer spending! Incredibly, according to an analysis by the San Francisco Fed, there’s still positive excess pandemic-era savings in the economy as of February 2024.2 It’s true that the excess $2.1 trillion in savings accumulated between 2020-21 have just about been entirely drawn down, but they have not yet been fully exhausted. This is one more reason that higher rates have yet to clamp down on consumer demand — we need to work through excess savings before higher borrowing costs make themselves felt.
Finally, fiscal policy continues to be stimulative: The annual federal budget deficit is more than 6% of GDP.3 Outside of wartime, that’s unprecedented for an expansionary economy. Next, consider that total public federal debt stands at 122% of GDP. The upshot is that we are left with little cushion or shock absorber if we do hit a pothole in the economic road.
These points beg the question: Do economic rules of thumb from the past still apply? We think they do. Recall that we showed above that all the classic macroeconomic steps followed one after another until falling down at the last hurdle. What was “wrong” with the prior forecasts is that they followed the timing of previous recessions.
Impact of Fed Policy Changes and Rising Interest Rates
A deeper dive into the mechanisms that translate policy changes to fundamental drivers of growth show that the recessionary effects may take longer to materialize than in the past.
Economic actors face death by a thousand cuts as older, lower-cost debt matures and must be refinanced at new, higher rates. How much higher? The last time the benchmark 10-year Treasury yield was this high was more than 15 years ago, in 2008.4 Short-term rates haven’t been this high in more than 40 years.
So even if the Fed authors modest rate cuts in 2024 as expected, monetary policy will still be restrictive relative to the prior decade. And with modest short-term rate cuts, longer-maturity yields need to stay at least as high as they are now for the yield curve to regain its typical upward shape.
That’s important to relieve some pressure from the troubled banking sector. With longer-term rates staying high, loans/refinancings are likely to provide a sustained headwind to economic growth as they gradually reset at higher rates for years to come.
Exploring the Path to Continuous Economic Growth
Before we conclude, let’s consider the alternative scenario in which the economy will grow uninterrupted. There’s support for this view in the stock market, where equity valuations and expectations for earnings growth are high. We see several potential sources for such continuous growth.
First, consumers keep spending as wage growth holds up and credit expands.
Second, investment is powered by expansionary fiscal policy.
The third potential growth driver is technology-driven productivity gains which expand aggregate supply, creating the holy grail of non-inflationary growth.
In the holy grail scenario, the yield curve could return to its normal, upward-sloping shape by short-term rates coming down, while longer-term yields stay in their current range.
Anticipating Economic Headwinds
Economic slowdown remains our base case for 2024. We think it’s more likely that tighter fiscal and monetary conditions ultimately lead to below-trend growth (less than 2%), if not outright recession.
Rate increases have not been absorbed in the economy. As inflation comes down, rates will become even more restrictive in real terms. Meanwhile, debt will keep resetting at higher rates for consumers, companies and the government.
Consumer demand set to slow? The old maxim is never bet against the U.S. consumer, but as we’ve highlighted, excess savings now finally appear to be tapped out.
The global context is negative for U.S. growth and inflation. In Europe, higher interest rates have already pushed many economies into recession. Debt overhangs and consumer confidence are real hurdles to Chinese growth. And geopolitical risks are very high, as wars in Europe and the Middle East threaten to further disrupt global trade and exacerbate high energy prices.
Add it all up, and we think it’s likely that the much-anticipated recession is still ahead of us as the economy gradually digests the big dose of monetary medicine served up by the Fed over the last year or so. We believe it is important to remain diversified amid current economic and market uncertainty.
Author
FRED Economic Data, “Household Debt Service Payments as a Percent of Disposable Personal Income,” Federal Reserve Bank of St. Louis, as of April 2, 2024.
Federal Reserve Bank of San Francisco, “Pandemic-Era Excess Savings,” accessed April 15, 2024.
FRED Economic Data, “Federal Surplus or Deficit [-] as Percent of Gross Domestic Product,” as of March 28, 2024.
FRED Economic Data, “Market Yield on U.S. Treasury Securities at 10-Year Constant Maturity, Quoted on an Investment Basis,” as of April 18, 2024.
Past performance is no guarantee of future results. Investment returns will fluctuate and it is possible to lose money.
The opinions expressed are those of American Century Investments (or the portfolio manager) and are no guarantee of the future performance of any American Century Investments' portfolio. This material has been prepared for educational purposes only. It is not intended to provide, and should not be relied upon for, investment, accounting, legal or tax advice.
The value and/or returns of a portfolio will fluctuate with market and economic conditions. Different investment styles tend to shift in and out of favor depending upon market and economic conditions, as well as investor sentiment. A portfolio may outperform or underperform other portfolios that employ a different investment style, and the stocks selected by the portfolio manager may not increase in value as predicted. Because this portfolio may, at times, concentrate its investments in a specific area, during such times it may be subject to greater risks and market fluctuations than when the portfolio represents a broader range of securities. Non-U.S. investing involves special risk considerations, including economic and political conditions, inflation rates and currency fluctuations. There is no guarantee that the investment objectives will be met. Dividends and yields represent past performance and there is no guarantee that they will continue to be paid. The information is not intended as a personalized recommendation or fiduciary advice and should not be relied upon for investment, accounting, legal or tax advice.
No offer of any security is made hereby. This material is provided for informational purposes only and does not constitute a recommendation of any investment strategy or product described herein. This material is directed to professional/institutional clients only and should not be relied upon by retail investors or the public. The content of this document has not been reviewed by any regulatory authority.