Earnings Watch: AI Drives Highest Earnings Growth in Years
Net profit margins and upward revisions were significant as well, despite volatility late in the quarter.

Key Takeaways
First-quarter earnings were strong, with AI leaders like Alphabet, Amazon and Meta boosting overall growth.
Margin strength and upward EPS revisions pointed to a healthy corporate profit backdrop.
Growth extended beyond AI, but war-related volatility and higher energy costs remain key risks.
Corporate earnings growth surged during the first quarter of 2026 as artificial intelligence (AI) fueled profits for mega-cap technology firms.
The S&P 500® Index experienced its largest jump in earnings growth since late 2021.1 Companies in the index reported some of their best net profit margins in years.2 Earnings-per-share (EPS) forecasts also saw upward revisions.3
In our view, this earnings season presents a constructive fundamental backdrop for investors. At the same time, the dispersion in results across companies and sectors shows the need for selective positioning.
Among this quarter’s highlights:
About 84% of companies in the S&P 500 beat analysts’ estimates.4 The strongest sectors were consumer discretionary, communication services, information technology (IT) and materials. Health care and energy were areas of weakness.
Emerging markets posted positive earnings growth, stronger than the previous quarter.5 IT, utilities and materials were the leading sectors. Consumer discretionary and communication services were the weakest.
In Japan, profit growth accelerated, led by consumer staples, materials and real estate.6 Health care and utilities were sources of weakness.
Europe recorded positive earnings growth.7 Energy, communication services and financials were the strongest sectors. Real estate and consumer discretionary were the weakest.
To gain a deeper understanding of the current market conditions and future expectations, explore our latest Investment Outlook.
Five Takeaways from Q1 Earnings Reports

1. AI Powers Earnings Season
Hyperscalers — the mega-cap tech firms investing heavily in AI models and infrastructure — reported robust first-quarter results.
Companies such as Alphabet, Amazon and Meta Platforms were leading contributors to the surge in the S&P 500’s earnings growth rate, according to FactSet.8
Alphabet said its revenues increased by 22%, with its cloud business up 63%. The company credited AI as a major driver of the gains.9
“Our AI investments and full-stack approach are lighting up every part of the business,” CEO Sundar Pichai said. “Search had a strong quarter with AI experiences driving usage, queries at an all-time high, and 19% revenue growth.”
2. Net Profit Margins Hit Their Highest Levels in Years
The largest firms’ AI spending remains robust. However, this could lead to increased pressure from investors if future capital expenditures cut into company margins too deeply.
Generally speaking, margins weren’t a problem in the first quarter.
For the first three months of 2026, the S&P 500’s average net profit margin was the strongest since FactSet began tracking it in 2009.10
AI’s impact could be seen here, too. Among all sectors, IT logged the largest year-over-year increase in net profit margin.
3. Growth Extends Beyond AI
Earnings growth wasn’t limited to the big players in AI. Other companies also posted better results, even if they didn’t reach the levels of Alphabet or Amazon. Most sectors reported earnings growth.11
Stronger growth could be seen across market capitalizations as well. Large-cap, mid-cap and small-cap stocks all participated, as shown in Figure 1.
Figure 1 | Large-Cap Stocks Led Earnings Per Share Growth
Cumulative Change in Analysts’ Next 12-Month Earnings Estimates
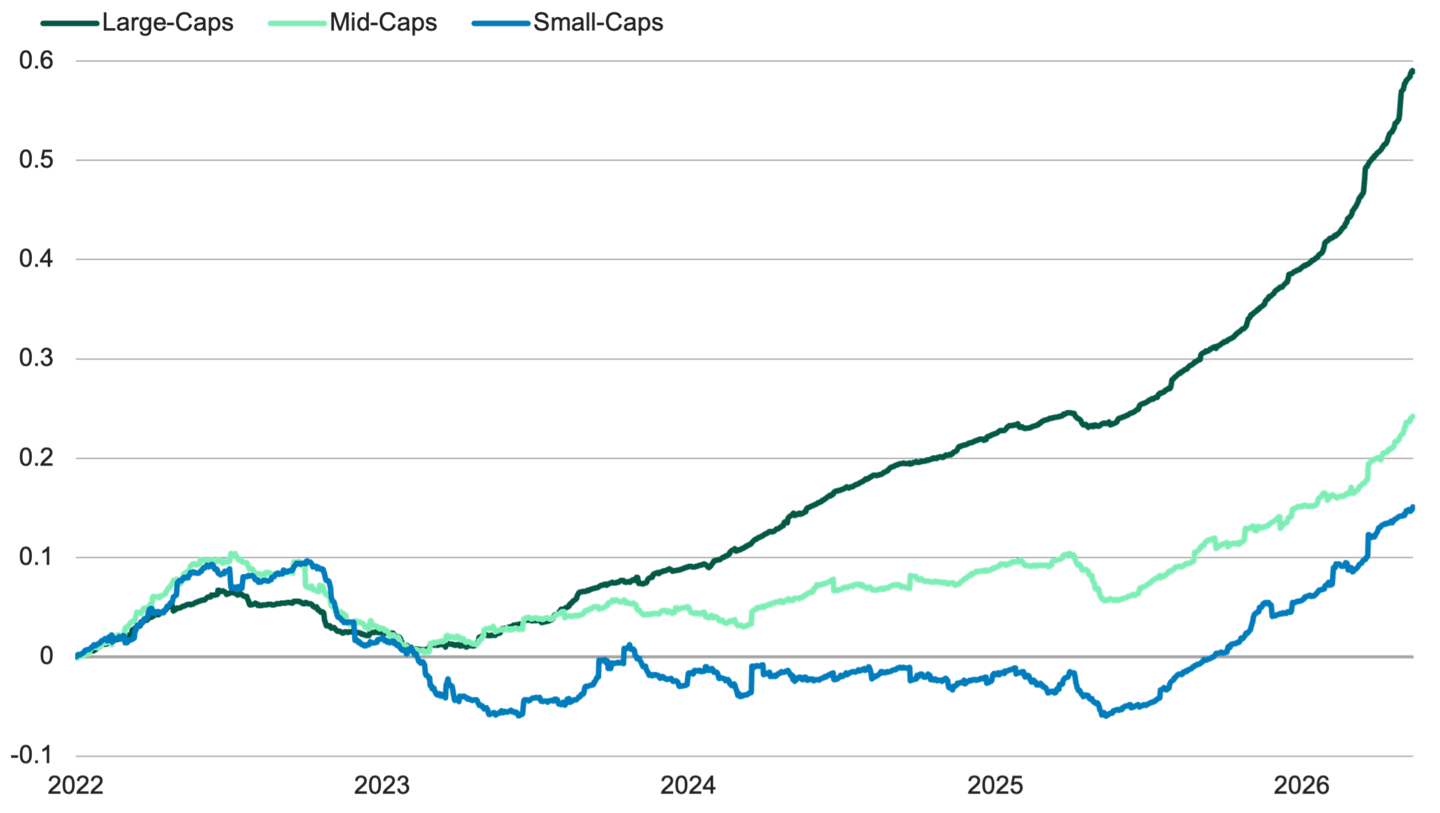
Data from 1/3/2022 – 5/3/2026. Source: Bloomberg. The S&P 500® Index represents large-caps. The S&P MidCap 400® Index represents mid-caps. The S&P SmallCap 600® Index represents small-caps. Past performance is no guarantee of future results.
4. The Rise of Agentic AI Could Support Future Earnings Growth
More companies are adopting agentic AI, which can plan and execute tasks with little or no human oversight. This type of AI requires greater investment in central processing units (CPUs) and memory, which could spur growth for select companies.
Morgan Stanley Research now estimates the total addressable market for CPUs will reach at least $125 billion by 2030, up from more than $100 billion. Demand for dynamic random-access memory (DRAM) could grow by 70%.12
AMD, Arm Holdings and Intel are seeing higher demand for their CPUs, just as demand for high-bandwidth memory stands to benefit Hynix, Micron and Samsung.
Arm Holdings, for example, reports that demand for its Arm AGI CPU has more than doubled, reaching $2 billion.13
“As AI is moving from human-based queries to continuous agent-driven workloads, this shift is expanding the role of the CPU,” Arm Holdings CEO Rene Anthony Andrada Haas said. “These agentic workloads require CPUs to coordinate tasks, move data, manage memory, enforce security and orchestrate work around accelerators.”
5. Macroeconomic Risk Hangs Over Upcoming Quarters
Despite a strong first quarter, the global economy remains vulnerable to disruptions from the war in Iran.
Much of the risk depends on how long the Strait of Hormuz, a vital conduit for oil and gas shipments, remains closed. Energy prices have soared, and they’re poised to ripple beyond the gas pump and into the larger economy.
Take Starbucks, for example, which reported positive results on its most recent earnings call. Company leadership is confident in the coffee chain’s turnaround, but they’re also keeping an eye on the broader economy.
“We haven’t seen a lot of the macro effects trickle into consumer behavior as it relates to Starbucks,” CEO Brian Niccol said.
“But I think we want to be cautious going forward because we’re not sure how this will play out as the issues continue to happen, whether it shows up in gas prices or utilities, or in other ways or other input costs like fuel costs.”14
Earnings Forecast: EM Growth Could Outpace Other Regions
Analysts predict 57.71% earnings growth in emerging markets for the second quarter and 38.34% for the full calendar year.15
Meanwhile, forecasts call for S&P 500 earnings growth of 20.11% for the second quarter and 21.37% for the year.16
Analysts expect European earnings growth of roughly 15% for both the second quarter and the full year.17 Japan’s earnings growth is forecasted at 21.06% in the second quarter and 9.30% for the year.18
Authors
Senior Client Portfolio Manager
Senior Client Portfolio Manager
Learn More About Our Global Growth Strategies
We focus on investing in companies with accelerating growth characteristics and earnings power.
Related Insights
John Butters, “S&P 500 Earnings Season Update: May 8, 2026,” FactSet, May 8, 2026.
John Butters, “S&P 500 Reporting Highest Net Profit Margin in More Than 15 Years,” FactSet, April 27, 2026.
John Butters, “Analysts Making Largest Increases in Quarterly EPS Estimates for S&P 500 in 5 Years,” FactSet, May 5, 2026.
FactSet, S&P 500 Index, as of 5/13/2026.
FactSet, MSCI EM Index, as of 5/13/2026.
FactSet, MSCI Japan Index, as of 5/13/2026.
FactSet, MSCI Europe Index, as of 5/13/2026.
John Butters, “S&P 500 Earnings Season Update: May 8, 2026,” FactSet, May 8, 2026.
Alphabet, “Alphabet Announces First Quarter 2026 Results,” Earnings Release, April 29, 2026.
John Butters, “S&P 500 Reporting Highest Net Profit Margin in More Than 15 Years,” FactSet, April 27, 2026.
John Butters, “S&P 500 Earnings Season Update: May 8, 2026,” FactSet, May 8, 2026.
Morgan Stanley Research, “Agentic AI – The Surge Begins,” May 11, 2026.
Arm Holdings, Q4 2026 Earnings Call, May 6, 2026.
Starbucks, Q2 2026 Earnings Call, April 28, 2026.
FactSet, as of 5/13/2026.
FactSet, as of 5/13/2026.
FactSet, as of 5/13/2026.
FactSet, as of 5/13/2026.
Forecasts are not a reliable indicator of future performance.
The opinions expressed are those of American Century Investments (or the portfolio manager) and are no guarantee of the future performance of any American Century Investments portfolio. This material has been prepared for educational purposes only. It is not intended to provide, and should not be relied upon for, investment, accounting, legal or tax advice.
The information is not intended as a personalized recommendation or fiduciary advice and should not be relied upon for investment, accounting, legal or tax advice.
References to specific securities are for illustrative purposes only and are not intended as recommendations to purchase or sell securities. Opinions and estimates offered constitute our judgment and, along with other portfolio data, are subject to change without notice.
No offer of any security is made hereby. This material is provided for informational purposes only and does not constitute a recommendation of any investment strategy or product described herein. This material is directed to professional/institutional clients only and should not be relied upon by retail investors or the public. The content of this document has not been reviewed by any regulatory authority.
©2026 Standard & Poor's Financial Services LLC. The S&P 500® Index is composed of 500 selected common stocks most of which are listed on the New York Stock Exchange. It is not an investment product available for purchase.