2025 Multi-Asset Strategies Outlook
Second Quarter

Key Takeaways
The market may shrug off proposed policies that are perceived as negotiating tactics, or that don’t impact growth or profits directly.
The market's March tariff tantrum demonstrates that investors will react when tariffs are actually applied and threaten the economy.
Understanding When Uncertainty Leads to Market Volatility
You’ve undoubtedly been inundated with talk about policy uncertainty and market volatility. Not so fast! I think clarifying when and why uncertainty doesn’t always equal market volatility is important.
Yes, uncertainty is anathema to financial markets. But note that despite daily headlines about dramatic policy proposals, the stock market didn't tank immediately after the election.
Figure 1 shows the sharp disconnect between a widely used metric of policy uncertainty and U.S. stock market volatility, as measured by the CBOE Volatility Index (VIX), through January, the latest period for which data are available. Despite the media’s myopic focus on policy uncertainty, the market actually rose through mid-February, while VIX hung around its longer-term normal level until those policies began to actively threaten economic and corporate earnings growth.
Figure 1 | Disconnect Between Policy Uncertainty and Market Volatility
VIX Index vs. Global Economic Policy Uncertainty (EPU) Index
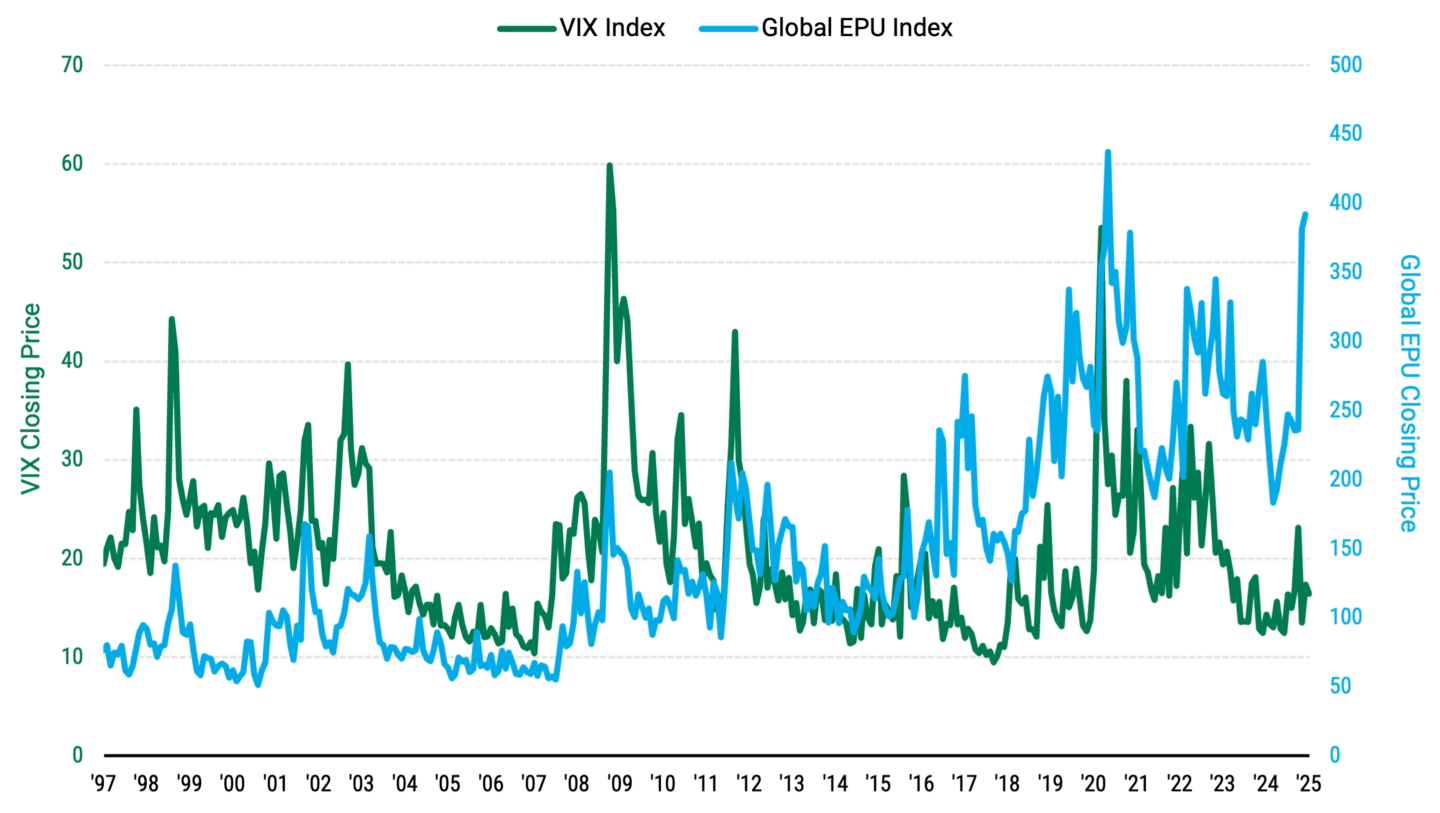
Data from 1/31/1997 - 1/31/2025. Source: FactSet.
Of course, policy uncertainty, in this case, was overplayed. Most of the policies President Donald Trump has announced so far are laid out clearly in the Heritage Foundation’s Project 2025. If it’s not included in the Project 2025 document, we are likely seeing a return to policies from the first Trump administration. Tariffs exemplify one of Trump's most lasting policies, tracing back to his first presidential campaign.
How Economic Factors Can Influence Market Volatility
Although market volatility has been present over the past year, it's important to clarify that economic uncertainty rather than policy changes have driven these movements. For example, in August 2024, stocks fell sharply because investors feared an economic hard landing. Then, in December, stocks slid as still-sticky inflation caused a reassessment of expectations for Federal Reserve (Fed) rate cuts. And in January, leading tech stocks sold off sharply amid questions about the fundamentals of the artificial intelligence (AI) trade.
There is strong evidence that markets will likely ignore all policy announcements unless there is a clear connection to economic growth or corporate profits. So, markets can shrug off tariff talk if it’s perceived as a negotiating tactic or short-term ploy. In contrast, actual tariffs diligently applied over time that threaten economic growth and higher inflation would cause a market reaction.
This explains the March tariff tantrum — the big market reaction when Trump made clear that tariffs would take effect on Canadian, Mexican and Chinese imports to the U.S. This is one of several Trump policies that could potentially raise prices across the economy while also hindering growth, depending on their implementation and duration. That’s precisely why we argue that the market focuses on the real economic impacts rather than the hypothetical possibilities of these policies.
The Importance of Diversification for Long-Term Success
Markets often don’t respond to every tweet or fleeting policy idea, and there’s good reason for that! You probably already have a carefully crafted long-term financial plan that aligns with your goals, risk tolerance and time horizon. The latest headlines shouldn’t influence these plans and goals.
We believe the prudent approach is sticking to your long-term financial targets regardless of the latest tweet storm. But if you absolutely have to do something, then rebalancing to your desired allocations is a way to satisfy that need. Rebalancing forces you to systematically sell high and buy low over time. If you’ve been applying that strategy, then in recent years you’ve been selling U.S. mega-cap stocks and buying more non-U.S., small-cap, and value-oriented shares on the margin.
To clarify, I'm not suggesting immediately selling large-cap stocks. We think the current momentum and short-term economic fundamentals appear favorable. However, it may be wise to ensure that your portfolio's allocations to bonds and other overlooked asset classes align with your long-term investment strategy.
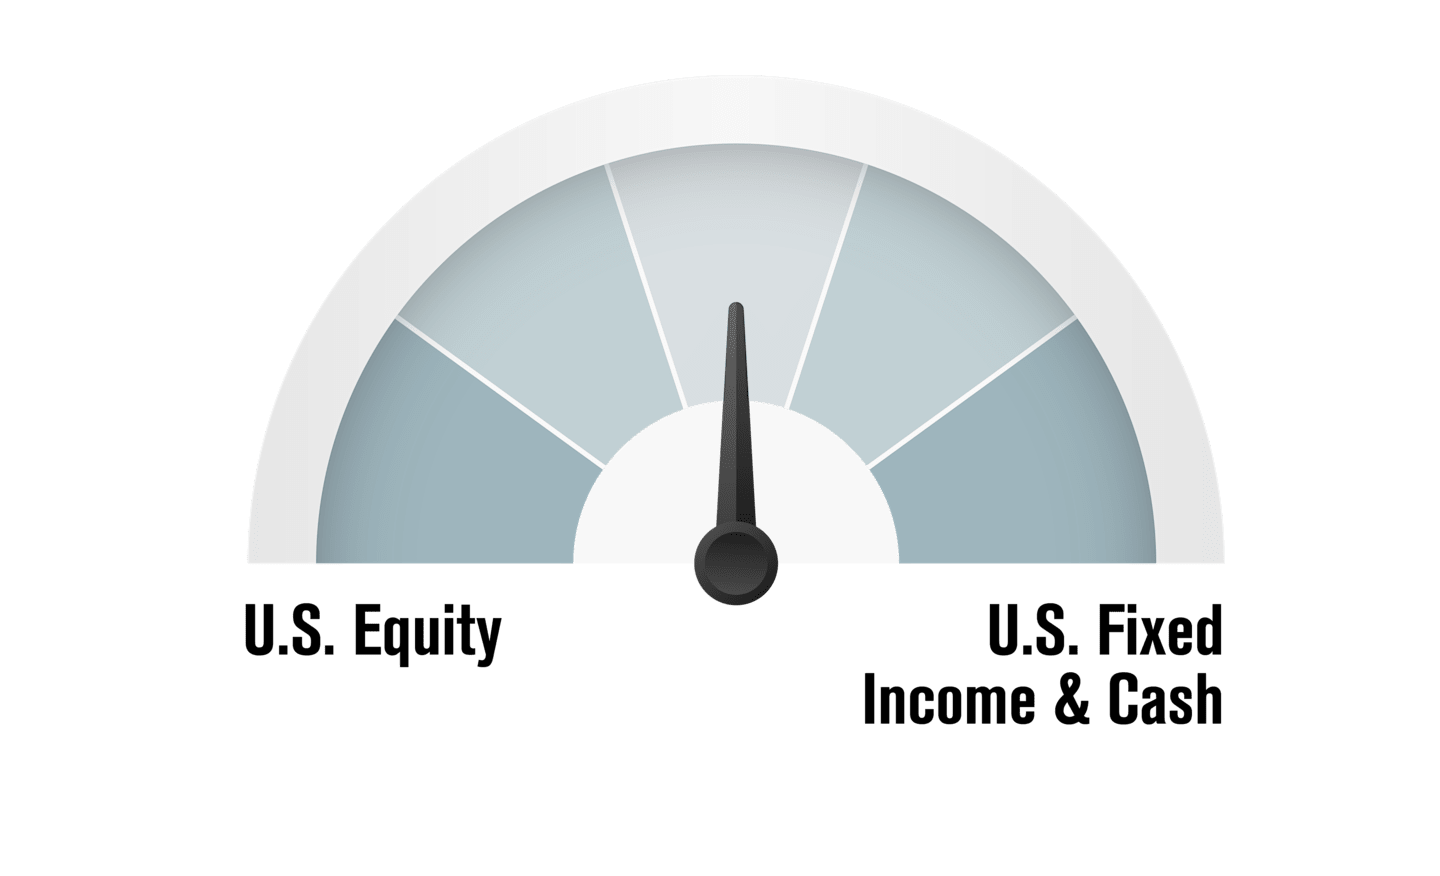
Asset Class
U.S. Equity | U.S. Fixed Income & Cash
For some time now, we’ve argued that financial markets are at the intersection of historically high uncertainty and valuations. Instead of adding risk, we believe the best approach is to take profits from overvalued segments and add to relatively unloved ones, rebalancing portfolios toward predetermined, long-term asset allocation targets.
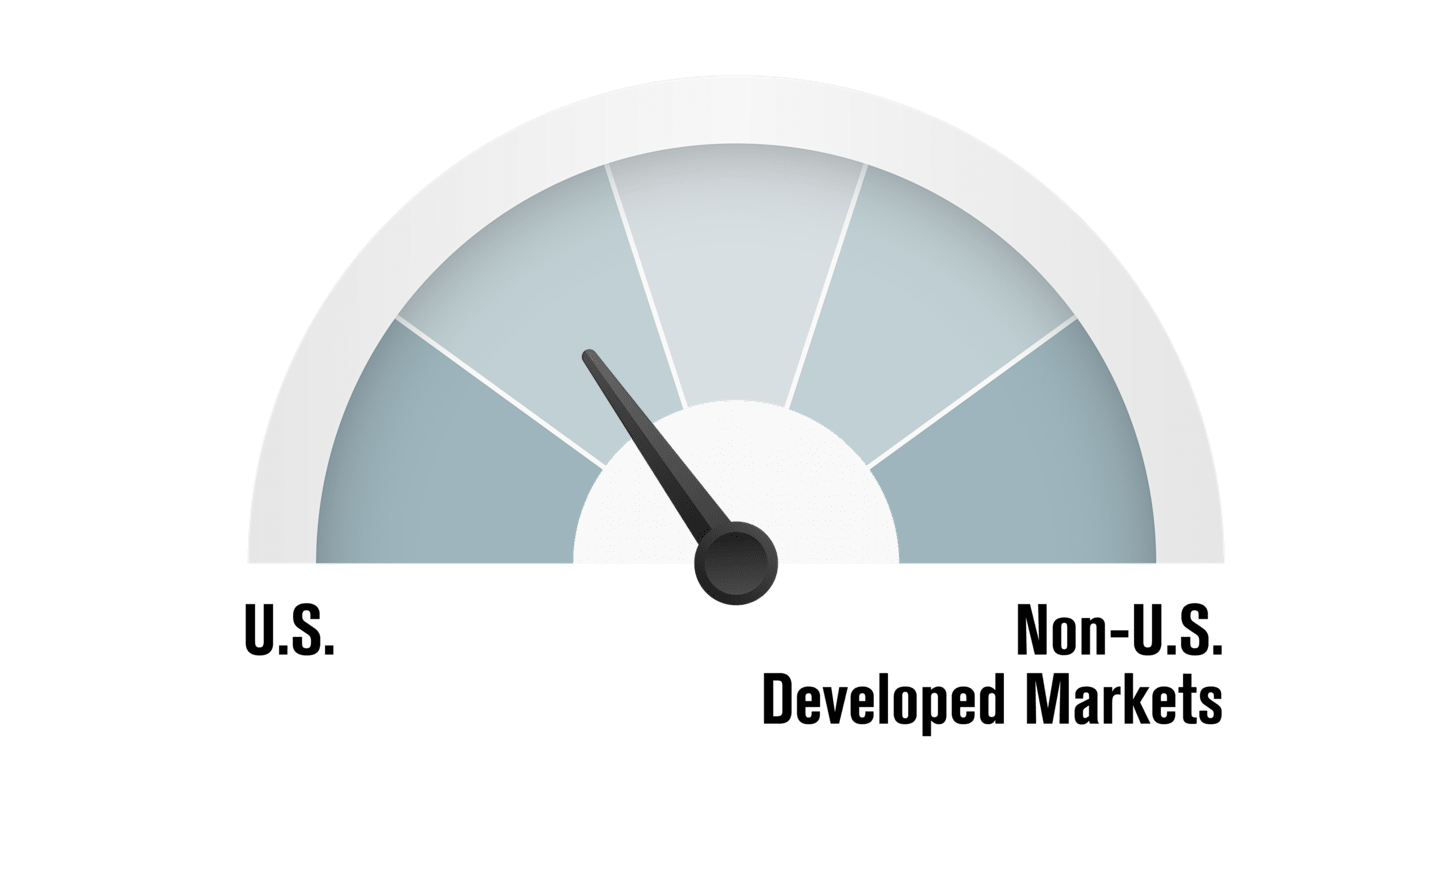
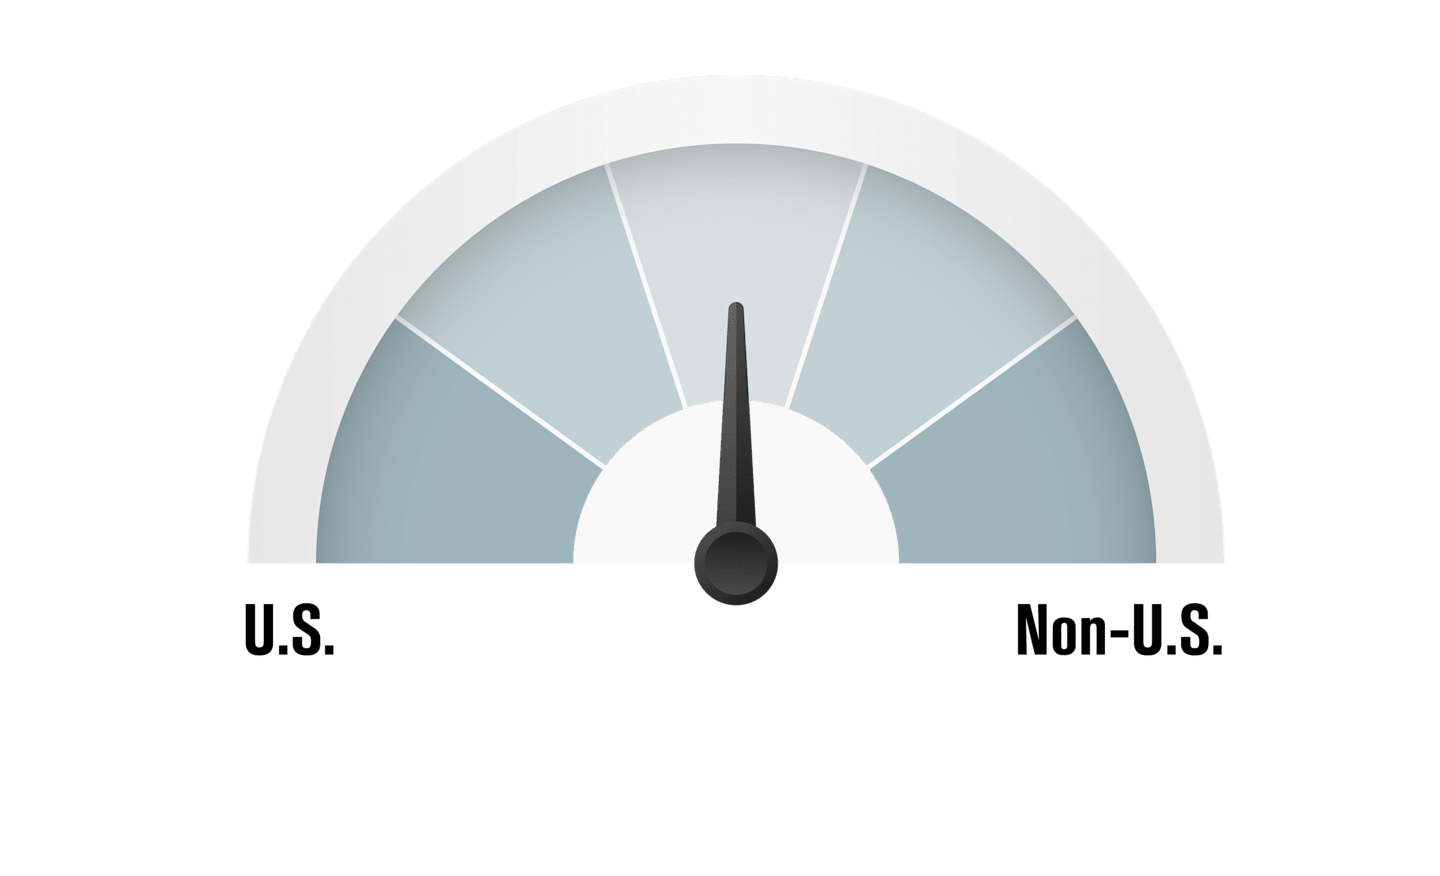
Equity Region
U.S. | Developed Markets
We’ve experienced a sharp momentum reversal in the last month or so, and as a result, sentiment indicators now favor European and other non-U.S. equities over U.S. stocks. However, our model favors the U.S. overall for fundamental reasons. Domestic companies enjoy stronger forward earnings projections, the U.S. economy is producing better relative growth and long-term U.S. bond yields are declining.
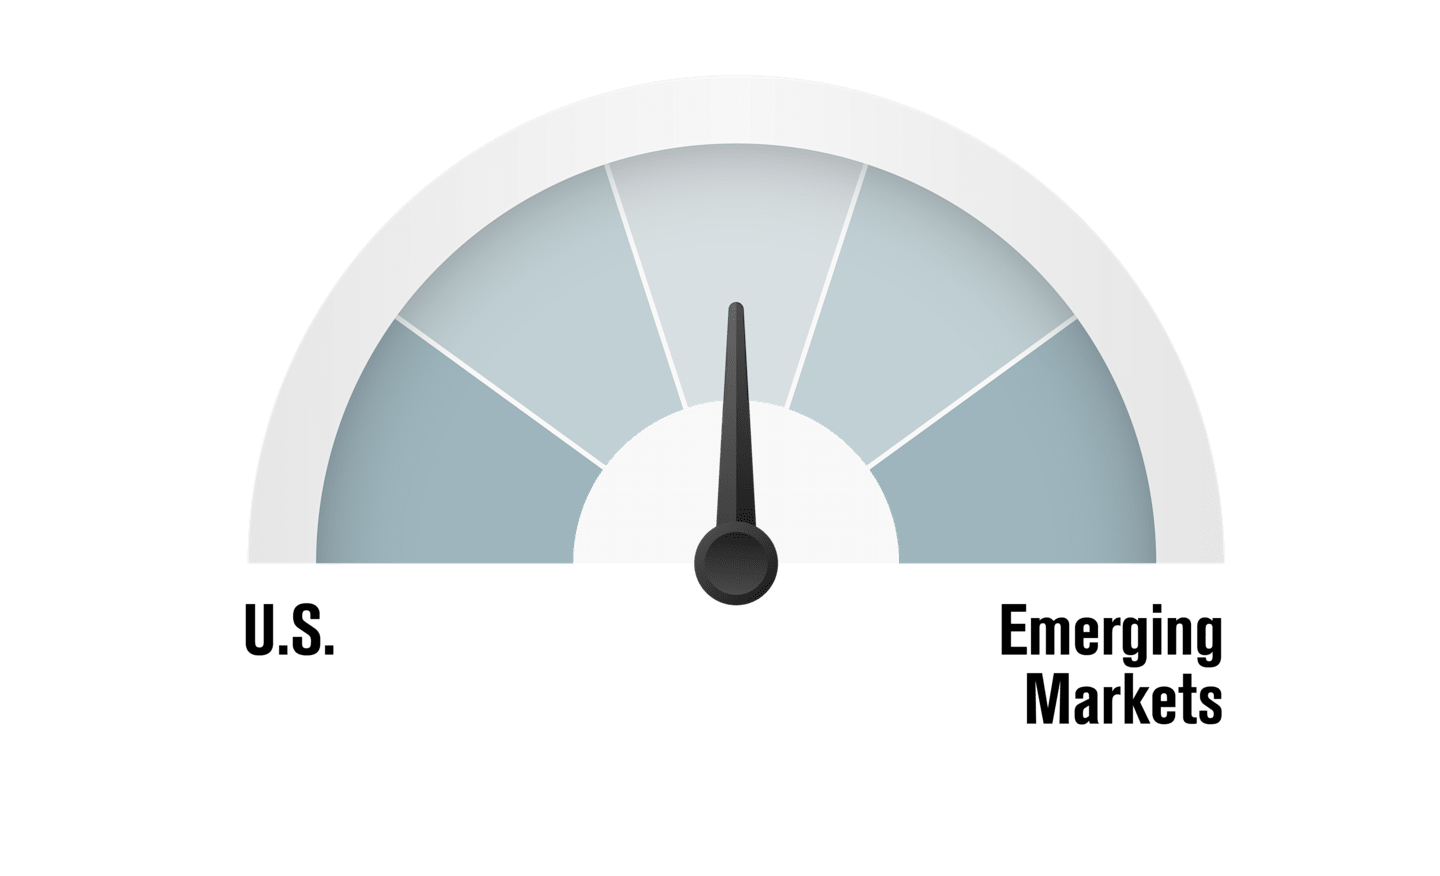
U.S. | Emerging Markets
Emerging markets (EM) equities are such a broad, diverse asset class that we are delighted to have experienced managers actively analyzing and selecting stocks for our portfolios. Tariffs generally complicate the outlook for growth and corporate profits, muddying the outlook for the overall asset class. Of course, not all companies will be affected or respond equally. We believe our managers are well-suited to capture this competitive differentiation.
U.S. Equity Size & Style
Large Cap | Small Cap
One area where the theme of uncertainty is abundantly clear is positioning by cap size. On the one hand, large-cap companies are more exposed than small-cap companies to global trade. On the other hand, smaller, more domestically focused firms would likely be more vulnerable to a U.S. stagflationary outcome. Add it all up, and we’re happy to remain at our long-term strategic weights.
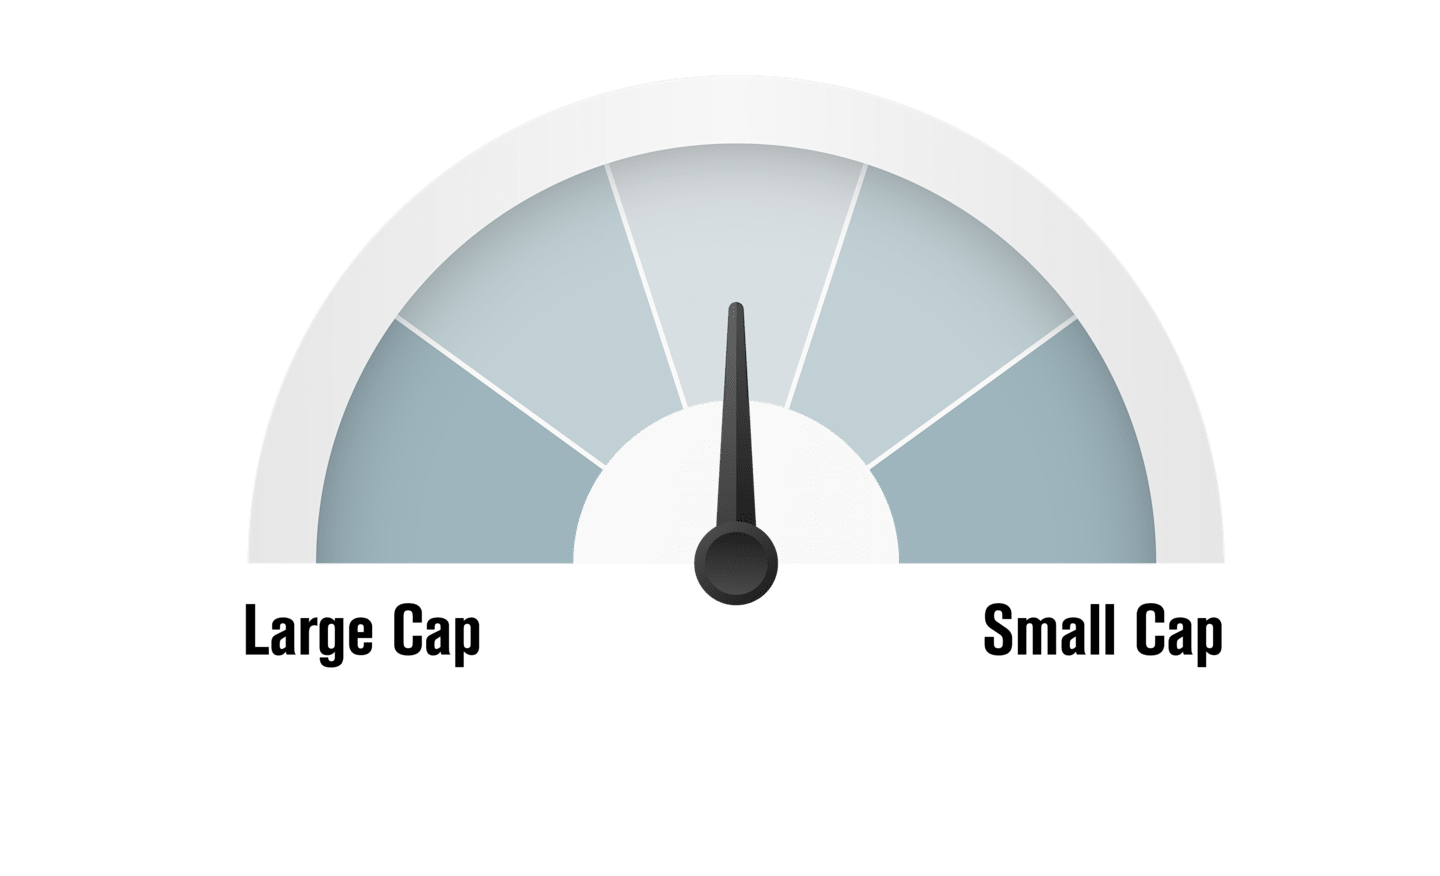
Growth | Value
After a period of growth outperformance, value has recently performed better. That’s one more data point in favor of rebalancing to predetermined strategic allocations. Our model is split on stocks by style, so we remain neutral while we wait for more clarity on the economy, monetary policy and investor sentiment.

Fixed Income
U.S. | Non-U.S.
In terms of fixed-income sectors, our managers believe Treasury yields are rich for now and prefer mortgage- and other asset-backed securities. By credit quality, our models prefer investment-grade over high-yield bonds because of relative valuations and narrow yield spreads. Within high yield, our fixed-income managers favor comparatively higher-quality bonds rated BB and B.
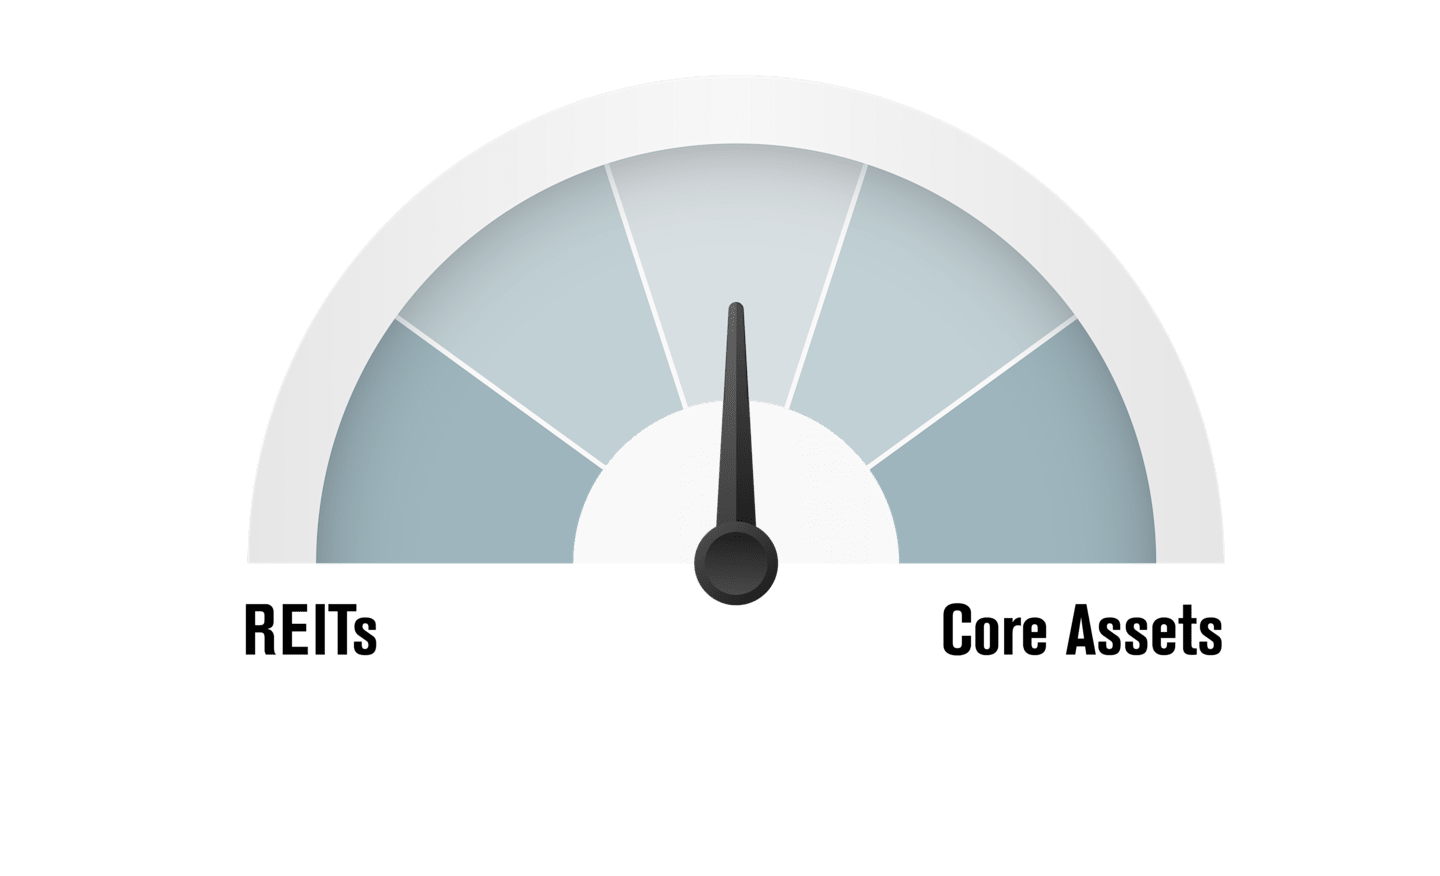
Alternatives
Real Estate Investment Trusts (REITs) | Core Assets
This is another area where we prefer to maintain a neutral strategic allocation.
Inflation in Focus
Get market updates, behavioral insights and investment ideas.
View Glossary Definitions
Agency mortgages
A form of securitized debt that represents ownership in pools of mortgage loans and their payments.
Asset-backed securities (ABS)
A form of securitized debt (defined below), ABS are structured like mortgage-backed securities (MBS, defined below). But instead of mortgage loans or interest in mortgage loans, the underlying assets may include such items as auto loans, home equity loans, student loans, small business loans, and credit card debt. The value of an ABS is affected by changes in the market's perception of the assets backing the security, the creditworthiness of the servicing agent for the loan pool, the originator of the loans, or the financial institution providing any credit enhancement.
Basis points
Basis points are used in financial literature to express values that are carried out to two decimal places (hundredths of a percentage point), particularly ratios, such as yields, fees, and returns. Basis points describe values that are typically on the right side of the decimal point--one basis point equals one one-hundredth of a percentage point (0.01%). So 25 basis points equals 0.25%, and 50 basis points equals 0.50%. Only when basis points equal or exceed 100 does the value move to the left of the decimal point--100 basis points equals 1.00%, 500 basis points equals 5.00%, etc.
BB and BBB credit rating
Securities and issuers rated AAA to BBB are considered/perceived “investment-grade”; those rated below BBB are considered/perceived non-investment-grade or more speculative.
Beta
Beta is a standard measurement of potential investment risk and return. It shows how volatile a security's or an investment portfolio's returns have been compared with their respective benchmark indices. A benchmark index's beta always equals 1. A security or portfolio with a beta greater than 1 had returns that fluctuated more, both up and down, than those of its benchmark, while a beta of less than 1 indicates less fluctuation than the benchmark.
Bloomberg U.S. Aggregate Bond Index
Represents securities that are taxable, registered with the Securities and Exchange Commission, and U.S. dollar-denominated. The index covers the U.S. investment-grade fixed-rate bond market, with index components for government and corporate securities, mortgage pass-through securities, and asset-backed securities.
Central bank
Entity responsible for oversight of a nation’s monetary system, including policies and interest rates.
Chicago Board of Trade (CBOE) Volatility Indexes
Volatility indexes are forward-looking measures of the market's expectations of volatility (or how much a stock index's price moves). The CBOE manages and publishes three of the most widely used volatility indexes based on three major stock indexes: The VIX Index tracks the expected 30-day future volatility of the S&P 500 Index, the VXN Index tracks the expected 30-day future volatility of the NASDAQ-100 Index and the VXD Index tracks the expected 30-day future volatility of the Dow Jones Industrial Average Index. VIX, VXN and VXD are the ticker symbols for these three volatility indexes. The VIX in particular is a widely used measure of market risk and is often referred to as the "investor fear gauge."
Collateralized loan obligations (CLOs)
A form of securitized debt, typically backed by pools of corporate loans and their payments.
Commercial Mortgage-Backed Securities (CMBS)
MBS that represent ownership in pools of commercial real estate loans used to finance the construction and improvement of income-producing properties, including office buildings, shopping centers, industrial parks, warehouses, hotels, and apartment complexes.
Commercial paper
Short-term debt issued by corporations to raise cash and to cover current expenses in anticipation of future revenues.
Commodities
Commodities are raw materials or primary agricultural products that can be bought or sold on an exchange or market. Examples include grains such as corn, foods such as coffee, and metals such as copper.
Consumer Price Index (CPI)
CPI is the most commonly used statistic to measure inflation in the U.S. economy. Sometimes referred to as headline CPI, it reflects price changes from the consumer's perspective. It's a U.S. government (Bureau of Labor Statistics) index derived from detailed consumer spending information. Changes in CPI measure price changes in a market basket of consumer goods and services such as gas, food, clothing, and cars. Core CPI excludes food and energy prices, which tend to be volatile.
Corporate securities (corporate bonds and notes)
Debt instruments issued by corporations, as distinct from those issued by governments, government agencies, or municipalities. Corporate securities typically have the following features: 1) they are taxable, 2) they tend to have more credit (default) risk than government or municipal securities, so they tend to have higher yields than comparable-maturity securities in those sectors; and 3) they are traded on major exchanges, with prices published in newspapers.
Correlation
Correlation measures the relationship between two investments--the higher the correlation, the more likely they are to move in the same direction for a given set of economic or market events. So if two securities are highly correlated, they will move in the same direction the vast majority of the time. Negatively correlated investments do the opposite--as one security rises, the other falls, and vice versa. No correlation means there is no relationship between the movement of two securities--the performance of one security has no bearing on the performance of the other. Correlation is an important concept for portfolio diversification--combining assets with low or negative correlations can improve risk-adjusted performance over time by providing a diversity of payouts under the same financial conditions.
Coupon interest rate
The coupon interest rate is the stated/set interest rate that is assigned to each interest-paying fixed-income security when it is issued. It is used to calculate the security's periodic interest payments to investors; the coupon rate is applied to the security's principal value to generate interest payments.
Credit quality
Credit quality reflects the financial strength of the issuer of a security, and the ability of that issuer to provide timely payment of interest and principal to investors in the issuer's securities. Common measurements of credit quality include the credit ratings provided by credit rating agencies such as Standard & Poor's and Moody's. Credit quality and credit quality perceptions are a key component of the daily market pricing of fixed-income securities, along with maturity, inflation expectations and interest rate levels.
Credit ratings
Measurements of credit quality (defined below) provided by credit rating agencies (defined below). Those provided by Standard & Poor's typically are the most widely quoted and distributed, and range from AAA (highest quality; perceived as least likely to default) down to D (in default). Securities and issuers rated AAA to BBB are considered/perceived to be "investment-grade"; those below BBB are considered/perceived to be non-investment-grade or more speculative.
Debt security
A debt instrument, including bonds, certificates of deposit or preferred stocks.
Deflation
Deflation is the opposite of inflation (see Inflation); it describes a decline in prices for goods, assets and services, and is considered a highly undesirable economic outcome by economists and policymakers.
Dividend
A payment of a company's earnings to stockholders as a distribution of profits.
Dividend yield
The return earned by a stock investor, calculated by dividing the amount of annual dividends per share by the current share price of the stock.
Downside protection
Occurs when the investor or fund manager uses techniques attempting to prevent a decrease in the value of the investment.
Duration
Duration is an important indicator of potential price volatility and interest rate risk in fixed income investments. It measures the price sensitivity of a fixed income investment to changes in interest rates. The longer the duration, the more a fixed income investment's price will change when interest rates change. Duration also reflects the effect caused by receiving fixed income cash flows sooner instead of later. Fixed income investments structured to potentially pay more to investors earlier (such as high-yield, mortgage, and callable securities) typically have shorter durations than those that return most of their capital at maturity (such as zero-coupon or low-yielding noncallable Treasury securities), assuming that they have similar maturities.
Environmental, Social, Governance (ESG) Criteria
The risk and/or opportunity to a company's market valuation resulting from environmental, social and governance (ESG) factors. Depending on the sector, environmental and social factors include, but are not limited to, 1) climate change, 2) water stress, 3) product safety and quality (supply chain and manufacturing), 4) cybersecurity and data privacy, and 5) human capital management. Regardless of the sector, governance factors include: 1) business (mis)conduct, 2) board composition, independence and entrenchment, 3) accounting practices, 4) ownership structure, and 5) executive pay-for-sustainability performance alignment.
European Central Bank
Together with the national central banks of the European Union member states whose currency is the Euro (€), the European Central Bank (ECB) defines and implements the monetary policy for the Euro area.
Eurozone
The eurozone is sometimes referred to as the euro area and represents the member states that participate in the economic and monetary union (EMU) with the European Union (EU). The eurozone currently consists of: Austria, Belgium, Cyprus, Estonia, Finland, France, Germany, Greece, Ireland, Italy, Luxembourg, Malta, the Netherlands, Portugal, Slovakia, Slovenia, and Spain.
Federal funds rate (aka fed funds rate)
The federal funds rate is an overnight interest rate banks charge each other for loans. More specifically, it's the interest rate charged by banks with excess reserves at a Federal Reserve district bank to banks needing overnight loans to meet reserve requirements. It's an interest rate that's mentioned frequently within the context of the Federal Reserve's interest rate policies. The Federal Reserve's Open Market Committee (defined below) sets a target for the federal funds rate (which is a key benchmark for all short-term interest rates, especially in the money markets), which it then supports/strives for with its open market operations (buying or selling government securities).
Federal Reserve (Fed)
The Fed is the U.S. central bank, responsible for monetary policies affecting the U.S. financial system and the economy.
Floating rate
A floating rate is associated with payments that fluctuate with an underlying interest rate level, as opposed to paying fixed-rate income.
Fundamentals/fundamental analysis
Investment "fundamentals," in the context of investment analysis, are typically those factors used in determining value that are more economic (growth, interest rates, inflation, employment) and/or financial (income, expenses, assets, credit quality) in nature, as opposed to "technicals," which are based more on market price (into which fundamental factors are considered to have been "priced in"), trend, and volume factors (such as supply and demand), and momentum. Technical factors can often override fundamentals in near-term investor and market behavior, but, in theory, investments with strong fundamental supports should maintain their value and perform relatively well over long time periods.
Global Economic Policy Uncertainty Index
The Global Economic Policy Uncertainty Index aims to quantify the level of uncertainty surrounding future economic policies based on news coverage, tax regulations and economic forecasts. The global index is an average of national economic policy uncertainty indices for 20 countries.
Gross domestic product
Gross domestic product (or GDP) is a measure of the total economic output in goods and services for an economy.
High-yield bonds
High-yield bonds are fixed income securities with lower credit quality and lower credit ratings. High-yield securities are those rated below BBB- by Standard & Poor's.
Inflation
Inflation, sometimes referred to as headline inflation, reflects rising prices for consumer goods and services, or equivalently, a declining value of money. Core inflation excludes food and energy prices, which tend to be volatile. It is the opposite of deflation (see Deflation).
Inflation-protected securities
Debt securities that offer returns adjusted for inflation; a feature designed to eliminate the inflation risk.
Investment-grade corporate bond or credit
A debt security with a relatively low risk of default issued and sold by a corporation to investors.
Liquidity
Liquidity describes the degree to which an asset or security can be quickly bought or sold in the market without affecting the asset's price.
Magnificent Seven
This phrase refers to seven stocks that have been high-performing in the technology sector — Alphabet, Amazon, Apple, Meta Platforms, Microsoft, NVIDIA and Tesla.
Mortgage-backed securities (MBS)
A form of securitized debt (defined below) that represents ownership in pools of mortgage loans and their payments. Most MBS are structured as "pass-throughs"--the monthly payments of principal and interest on the mortgages in the pool are collected by the financial entity that is servicing the mortgages and are "passed through" monthly to investors. The monthly and principal payments are key differences between MBS and other bonds such as Treasuries, which pay interest every six months and return the whole principal at maturity. Most MBS are issued or guaranteed by the U.S. government, a government-sponsored enterprise (GSE), or by a private lending institution.
MSCI ACWI IMI
The MSCI ACWI Investable Market Index (IMI) captures large, mid and small cap representation across 23 Developed Markets (DM) and 24 Emerging Markets (EM) countries. With 9,139 constituents, the index is comprehensive, covering approximately 99% of the global equity investment opportunity set.
MSCI World Index
A free float-adjusted market capitalization weighted index that is designed to measure the equity market performance of developed markets.
Municipal bonds
These are long-term municipal securities (defined below) with maturities of 10 years or longer.
Municipal securities (munis)
Debt securities typically issued by or on behalf of U.S. state and local governments, their agencies or authorities to raise money for a variety of public purposes, including financing for state and local governments as well as financing for specific projects and public facilities. In addition to their specific set of issuers, the defining characteristic of munis is their tax status. The interest income earned on most munis is exempt from federal income taxes. Interest payments are also generally exempt from state taxes if the bond owner resides within the state that issued the security. The same rule applies to local taxes. Another interesting characteristic of munis: Individuals, rather than institutions, make up the largest investor base. In part because of these characteristics, munis tend to have certain performance attributes, including higher after-tax returns than other fixed income securities of comparable maturity and credit quality and low volatility relative to other fixed-income sectors. The two main types of munis are general obligation bonds (GOs) and revenue bonds. GOs are munis secured by the full faith and credit of the issuer and usually supported by the issuer's taxing power. Revenue bonds are secured by the charges tied to the use of the facilities financed by the bonds.
Nominal yield
For most bonds and other fixed-income securities, nominal yield is simply the yield you see listed online or in newspapers. Most nominal fixed-income yields include some extra yield, an "inflation premium," that is typically priced/added into the yields to help offset the effects of inflation (see Inflation). Real yields (see Real yield), such as those for TIPS (see TIPS), don't have the inflation premium. As a result, nominal yields are typically higher than TIPS yields and other real yields.
Non-agency commercial mortgage-backed securities (CMBS)
MBS that represent ownership in pools of commercial real estate loans used to finance the construction and improvement of income-producing properties. Non-agency CMBS are not guaranteed by the U.S. government or a government-sponsored enterprise.
PCE
The personal consumption expenditures ("PCE") price deflator—which comes from the Bureau of Economic Analysis' quarterly report on U.S. gross domestic product—is based on a survey of businesses and is intended to capture the price changes in all final goods, no matter the purchaser. Because of its broader scope and certain differences in the methodology used to calculate the PCE price index, the Federal Reserve ("the Fed") holds the PCE deflator as its preferred, consistent measure of inflation over time.
Price to earnings ratio (P/E)
The price of a stock divided by its annual earnings per share. These earnings can be historical (the most recent 12 months) or forward-looking (an estimate of the next 12 months). A P/E ratio allows analysts to compare stocks on the basis of how much an investor is paying (in terms of price) for a dollar of recent or expected earnings. Higher P/E ratios imply that a stock's earnings are valued more highly, usually on the basis of higher expected earnings growth in the future or higher quality of earnings.
Producer Price Index (PPI)
Measures the average change over time in the selling prices received by domestic producers for their output. The prices included in the PPI are from the first commercial transaction for many products and some services.
Quality
Nationally recognized statistical rating organizations assign quality ratings to reflect forward-looking opinions on the creditworthiness of loan issuers.
Quantitative easing (QE)
A form of monetary policy used by central banks to stimulate economic growth. In QE, a central bank (such as the U.S. Federal Reserve) buys domestic government securities to increase the domestic money supply, lower interest rates, and encourage investors to make investments in riskier assets such as stocks and high-yield securities.
Real estate investment trusts (REITs)
Real estate investment trusts (REITs) are securities that trade like stocks and invest in real estate through properties or mortgages.
Real yield
For most bonds and other fixed-income securities, real yield is simply the yield you see listed online or in newspapers (see Yield) minus the premium (extra yield) added to help counteract the effects of inflation (see Inflation). Most "nominal" fixed-income yields (see Nominal yield) include an "inflation premium" that is typically priced into the yields to help offset the effects of inflation. Real yields, such as those for TIPS, don't have the inflation premium. As a result, TIPS yields and other real yields are typically lower than most nominal yields.
Russell 1000® Growth Index
Measures the performance of those Russell 1000 Index companies (the 1,000 largest publicly traded U.S. companies, based on total market capitalization) with higher price-to-book ratios and higher forecasted growth values.
Russell 1000® Value Index
Measures the performance of those Russell 1000 Index companies (the 1,000 largest publicly traded U.S. companies, based on total market capitalization) with lower price-to-book ratios and lower forecasted growth values.
S&P 500® Growth Index
A style-concentrated index designed to track the performance of stocks that exhibit the strongest growth characteristics by using a style-attractiveness weighting scheme.
S&P 500® Index
The S&P 500® Index is composed of 500 selected common stocks most of which are listed on the New York Stock Exchange. It is not an investment product available for purchase.
S&P 500® Value Index
The S&P 500 Value Index is a style-concentrated index that measures stocks in the S&P 500 using three factors: the ratios of book value, earnings, and sales to price. It is not an investment product available for purchase.
S&P MidCap 400® Index
Provides investors with a benchmark for mid-sized companies. The index covers over 7% of the U.S. equity market, and seeks to remain an accurate measure of mid-sized companies, reflecting the risk and return characteristics of the broader mid-cap universe on an on-going basis.
S&P SmallCap 600® Index
A capitalization-weighted index consisting of 600 domestic stocks, measures the small company segment of the U.S. market.
Securitized debt
Debt resulting from the process of aggregating debt instruments into a pool of similar debts, then issuing new securities backed by the pool (securitizing the debt). Asset-backed and mortgage-backed securities (ABS and MBS, defined further above) and collateralized mortgage obligations (CMOs, defined above) are common forms of securitized debt. The credit quality (defined above) of securitized debt can vary significantly, depending on the underwriting standards of the original debt issuers, the credit quality of the issuers, economic or financial conditions that might affect payments, the existence of credit backing or guarantees, etc.
Senior-secured securities
A security that has a higher priority compared to another in the event of liquidation.
Sovereign debt
A country's own government-issued debt, priced in its native currency, that can be sold to investors in other countries to raise needed funds. For example, U.S. Treasury debt is U.S. sovereign debt, and would be referred to as sovereign debt when bought by foreign investors. Conversely, debt issued by foreign governments and priced in their currencies would be sovereign debt to U.S. investors.
Spreads (aka "interest-rate spreads", "maturity spreads," "yield spreads" or "credit spreads")
In fixed income parlance, spreads are simply measured differences or gaps that exists between two interest rates or yields that are being compared with each other. Spreads typically exist and are measured between fixed income securities of the same credit quality (defined above), but different maturities, or of the same maturity, but different credit quality. Changes in spreads typically reflect changes in relative value, with "spread widening" usually indicating relative price depreciation of the securities whose yields are increasing most, and "spread tightening" indicating relative price appreciation of the securities whose yields are declining most (or remaining relatively fixed while other yields are rising to meet them). Value-oriented investors typically seek to buy when spreads are relatively wide and sell after spreads tighten.
Spread sectors (aka "spread products," "spread securities")
In fixed income parlance, these are typically non-Treasury securities that usually trade in the fixed income markets at higher yields than same-maturity U.S. Treasury securities. The yield difference between Treasuries and non-Treasuries is called the "spread" (defined further above), hence the name "spread sectors" for non-Treasuries. These sectors--such as corporate-issued securities and mortgage-backed securities (MBS, defined above)--typically trade at higher yields (spreads) than Treasuries because they usually have relatively lower credit quality (defined above) and more credit/default risk (defined above), and/or they have more prepayment risk (defined above).
Spread widening, tightening
Changes in spreads that reflect changes in relative value, with "spread widening" usually indicating relative price depreciation and "spread tightening" indicating relative price appreciation.
Stagflation
Stagflation describes slowing economic growth combined with high inflation.
Subordinated security
An unsecured loan or bond that ranks below more senior loans in terms of claims on assets or earnings.
Total return
For bonds and other fixed-income securities, total return is a standard performance measurement that incorporates both income (primarily from interest payments) and changes in the prices of the securities (see Price changes from market changes). It is viewed as a more complete measurement of fixed-income performance than yield alone.
Treasury Inflation-Protected Securities (TIPS)
TIPS are a special type of U.S. Treasury security designed to address a fundamental, long-standing fixed-income market issue: that the fixed interest payments and principal values at maturity of most fixed-income securities don't adjust for inflation. TIPS interest payments and principal values do. The adjustments include upward or downward changes to both principal and coupon interest based on inflation. TIPS are inflation-indexed; that is, tied to the U.S. government's Consumer Price Index (CPI). At maturity, TIPS are guaranteed by the U.S. government to return at least their initial $1,000 principal value, or that principal value adjusted for inflation, whichever amount is greater. In addition, as their principal values are adjusted for inflation, their interest payments also adjust.
Treasury note
A treasury note is a debt security issued by the U.S. government with a fixed interest rate and maturity ranging from one to 10 years.
Treasury yield
The yield (defined below) of a Treasury security (most often refers to U.S. Treasury securities issued by the U.S. government).
U.S. Treasury securities
Debt securities issued by the U.S. Treasury and backed by the direct "full faith and credit" pledge of the U.S. government. Treasury securities include bills (maturing in one year or less), notes (maturing in two to 10 years) and bonds (maturing in more than 10 years). They are generally considered among the highest quality and most liquid securities in the world.
Valuation
A quantitative estimate of a company or asset’s value.
VIX Index
See Chicago Board of Trade (CBOE) Volatility Indexes.
Yield
For bonds and other fixed-income securities, yield is a rate of return on those securities. There are several types of yields and yield calculations. "Yield to maturity" is a common calculation for fixed-income securities, which takes into account total annual interest payments, the purchase price, the redemption value, and the amount of time remaining until maturity.
Yield curve
A line graph showing the yields of fixed income securities from a single sector (such as Treasuries or municipals), but from a range of different maturities (typically three months to 30 years), at a single point in time (often at month-, quarter- or year-end). Maturities are plotted on the x-axis of the graph, and yields are plotted on the y-axis. The resulting line is a key bond market benchmark and a leading economic indicator.
Yield spread
A "spread," in fixed income parlance, is simply a difference. Yield spreads measure yield differences, typically between debt securities with high credit ratings (which typically have lower yields) and those with lower ratings (which typically have higher yields). Yield spreads can also be measured between debt securities with different maturities (shorter-maturity securities typically have lower yields and longer-maturity securities typically have higher yields).
References to specific securities are for illustrative purposes only and are not intended as recommendations to purchase or sell securities. Opinions and estimates offered constitute our judgment and, along with other portfolio data, are subject to change without notice.
International investing involves special risks, such as political instability and currency fluctuations. Investing in emerging markets may accentuate these risks.
Investment return and principal value of security investments will fluctuate. The value at the time of redemption may be more or less than the original cost. Past performance is no guarantee of future results.
Historically, small- and/or mid-cap stocks have been more volatile than the stock of larger, more-established companies. Smaller companies may have limited resources, product lines and markets, and their securities may trade less frequently and in more limited volumes than the securities of larger companies.
The letter ratings indicate the credit worthiness of the underlying bonds in the portfolio and generally range from AAA (highest) to D (lowest).
Diversification does not assure a profit nor does it protect against loss of principal.
Rebalancing allows you to keep your asset allocation in line with your goals. It does not guarantee investment returns and does not eliminate risk.
Generally, as interest rates rise, bond prices fall. The opposite is true when interest rates decline.
Past performance is no guarantee of future results. Investment returns will fluctuate and it is possible to lose money.
The opinions expressed are those of American Century Investments (or the portfolio manager) and are no guarantee of the future performance of any American Century Investments' portfolio. This material has been prepared for educational purposes only. It is not intended to provide, and should not be relied upon for, investment, accounting, legal or tax advice.